A reader asks:
I keep hearing about the Magnificent 7 stocks are carrying the stock market this year while the rest of the stocks are sucking wind. Does this even matter? I get that these stocks could fall and bring the market down with them but should we be worried about this level of concentration?
It’s true the Magnificent 7 stocks — Amazon, Apple, Facebook, Google, Microsoft, Nvidia and Tesla — are carrying the stock market this year.
The numbers are mind-boggling when you consider how big these companies are.
The average market capitalization for these 7 companies is $1.6 trillion. The average return for the Magnificent 7 this year is a gain of 105%!1
The average market cap of the remaining stocks in the S&P 500 is around $57 billion with an average return in 2023 of just 4%.
As of this writing, the S&P 500 itself is up close to 19% on the year after accounting for dividends.
People worry about this dynamic because they worry about what happens if and when these ginormous stocks roll over. These 7 stocks make up close to 30% of the S&P 500 by market cap. Microsoft and Apple alone are nearly 15% of the index.
This is a legitimate concern. If these stocks crash for some reason, the market will fall as well. It’s also possible the other stocks in the index will make up for some of those losses.
You don’t have to go back too far to see how this dynamic would play out.
In 2022, all of these stocks got rocked. Nvidia, Tesla, Facebook and Amazon were all down 50% or worse. The average return for the Magnificent 7 in 2022 was -46%. Each of these 7 stocks were down even more than the S&P 500.
The S&P 500 was down just 18% in total last year. That means other parts of the market picked up the slack. My guess is that would happen again but you can’t be sure of it.
However, if you invest in the stock market you should learn to become comfortable with returns being concentrated in a handful of stocks. This year is not normal in terms of short-term performance but over the longer-term most stocks stink while the biggest and best names shoulder most of the load.
My favorite study on this was research done by Hendrik Bessembinder from Arizona State University:
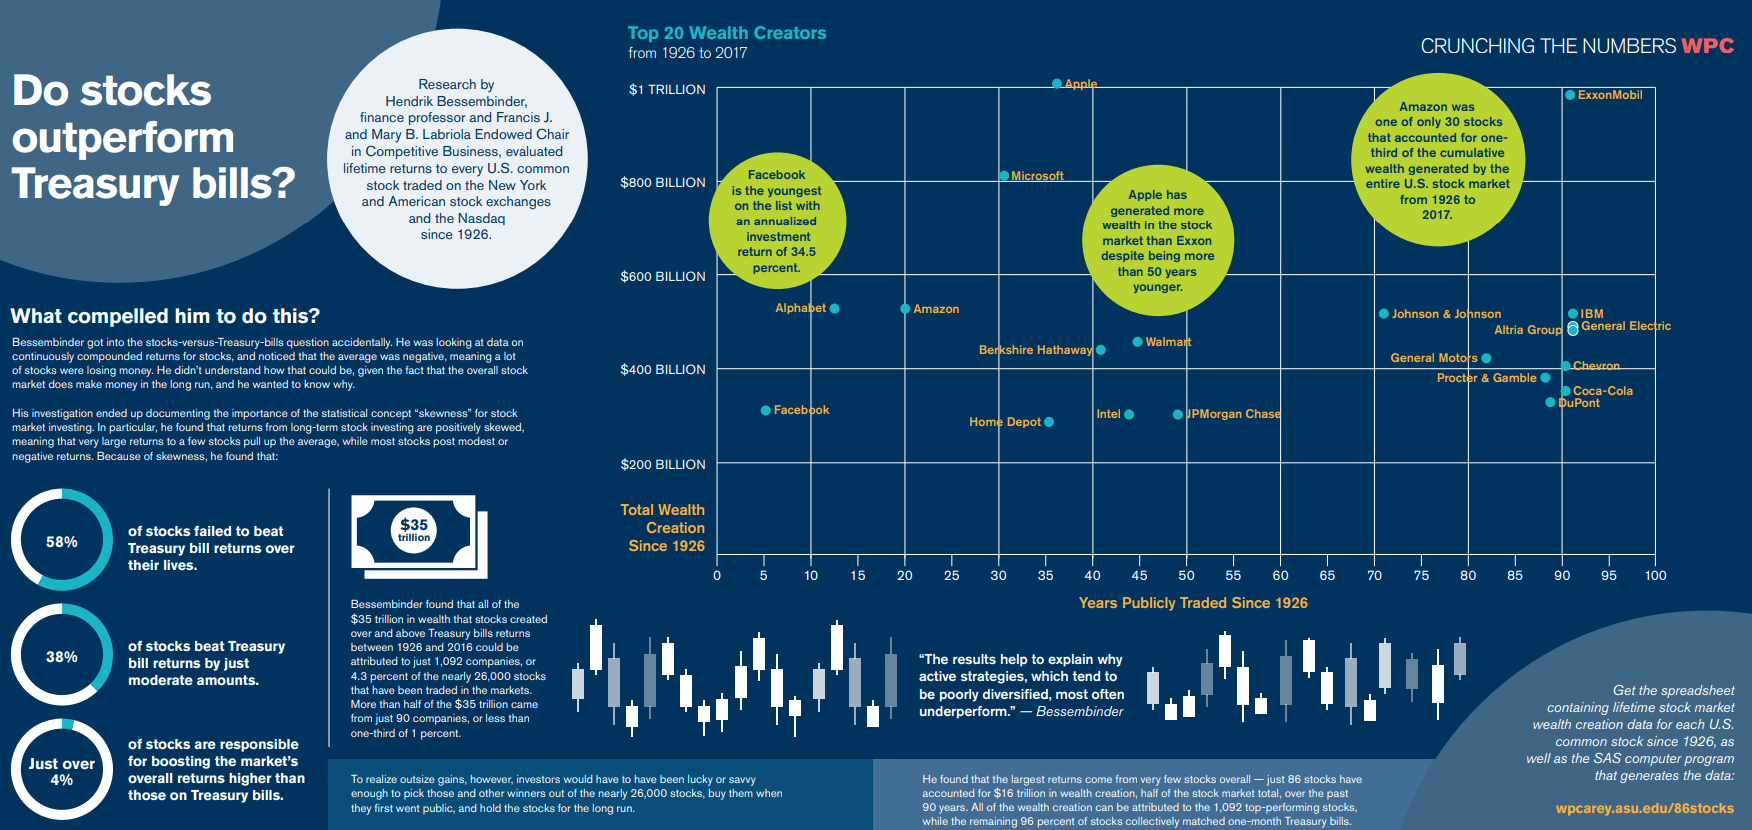
Bessimbinder found just 86 stocks accounted for half of all wealth creation in the U.S. stock market going back to 1926. All of the wealth creation in that time came from just 4% of stocks. Nearly 60% of stocks failed to beat T-bill returns over their lives. Close to 40% of stocks barely beat T-bills.
Of course, this is nearly 100 years of data. Plenty of stocks over this time had fantastic returns over shorter time frames before flaming out.2 My biggest takeaway from Bessimbinder’s work is it highlights the need for diversification since no one knows where the big winners are going to come from.
Apple was months away from going out of business in the 1990s before securing a loan from Bill Gates and Microsoft to stay afloat. Now it’s the biggest company in the U.S. stock market.
In a new paper titled Underperformance of Concentrated Stock Positions, Antti Petajisto from NYU took Bessimbinder’s stock even further by looking at the distribution of returns for stocks using shorter time frames.
This was the main takeaway:
Since 1926, the median ten-year return on individual U.S. stocks relative to the broad equity market is -7.9%, underperforming by 0.82% per year. For stocks that have been among the top 20% performers over the previous five years, the median ten-year market-adjusted return falls to -17.8%, underperforming by 1.94% per year. Since the end of World War II, the median ten-year market-adjusted return of recent winners has been negative for 93% of the time. The case for diversifying concentrated positions in individual stocks, particularly in recent market winners, is even stronger than most investors realize.
Allow me to sum up these findings — picking individual stocks is hard.
Petajisto created this neat chart that shows the distribution of returns for individual stocks over one month, one year, five years, ten years and twenty years:
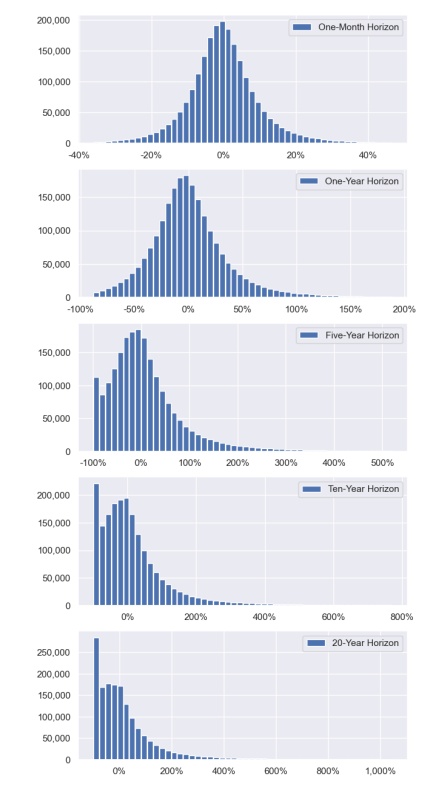
Just look at how many stocks show negative returns the longer you extend your time horizon. And if you look on the right side of the distribution just a handful of stocks account for the biggest gainers.
His research shows 55% of all stocks are losers over 10 year time frames, on average. This is true across sectors too:
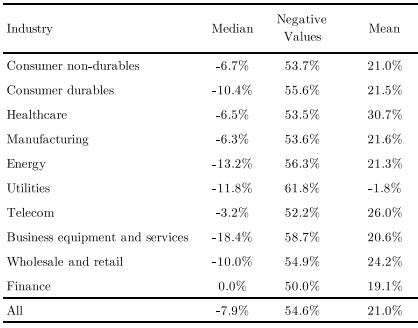
You could pick a stock in any sector and hold it for ten years, and there is a greater than 50% chance it will end up a loser.
The beautiful thing about the stock market is the winners have more than made up for the losers over time. While the median stock return is negative, the average is positive, which shows just how significant the gains can be from the winners.
So what does this tell us about the Magnificent 7 stocks?
Outsized gains are normal. It doesn’t feel right for a handful of stocks to experience the biggest returns but this is the norm in the stock market over the long run.
Some of these stocks are going to underperform (eventually). Interestingly enough, underperformance increases when you pick the top 20% of stocks over the previous five years:
The relative underperformance over rolling ten-year periods increases to 17.8% (or 1.94% per year) when considering only stocks whose performance ranked in the top 20% over the prior five years.
These tech behemoths have already defied the laws of gravity so I wouldn’t want to put myself in a position of guessing which ones are going to underperform in the coming years. But there’s a high likelihood of it happening to some of them.
Other stocks will pick up the slack. Sure, some of the Magnificient 7 stocks will falter eventually. They can’t keep this up forever.
Microsoft is the only one of these stocks that was in the top 10 of the S&P 500 in the year 2000. Others on the list include companies like General Electric, Citigroup, Cisco and AIG. These stocks all went on to underperform in a big way but the new giants stepped up and took their place.
I don’t know who the up-and-comers will be in the years ahead but it will happen again at some point.
Concentration can be a killer. Holding concentrated positions in the stock market gives you the opportunity to outperform but also increases your chances of underperforming by a wide margin.
The problem with trying to outperform through concentration is the probabilities are stacked against you. For every Buffett, there are thousands of other investors who tried and failed to hold concentrated positions. We never hear about the losers.
Diversification not only helps manage risk in a portfolio but also increases your return in the stock market by giving you more opportunity to own the biggest winners.
We spoke about this question on the latest edition of Ask the Compound:
My colleague Alex Palumbo joined me again this week to answer questions about what to do with wedding money, the pros and cons of getting your MBA, tax-deferred retirement accounts and how to track your finances.
Further Reading:
Concentration in the Stock Market
1To be fair the average is skewed by Nvidia’s ~240% gain in 2023. But the median return is still almost 75% this year for these 7 stocks.
2This also doesn’t mean the biggest stocks are the only areas to invest in. The S&P 600 Small Cap Index is up 10.4% per year since inception in 1995. The S&P 400 Mid Cap Index is up 11.4% per year. Many of the biggest stocks started out small.

