The Nasdaq 100 is up more than 50% this year.
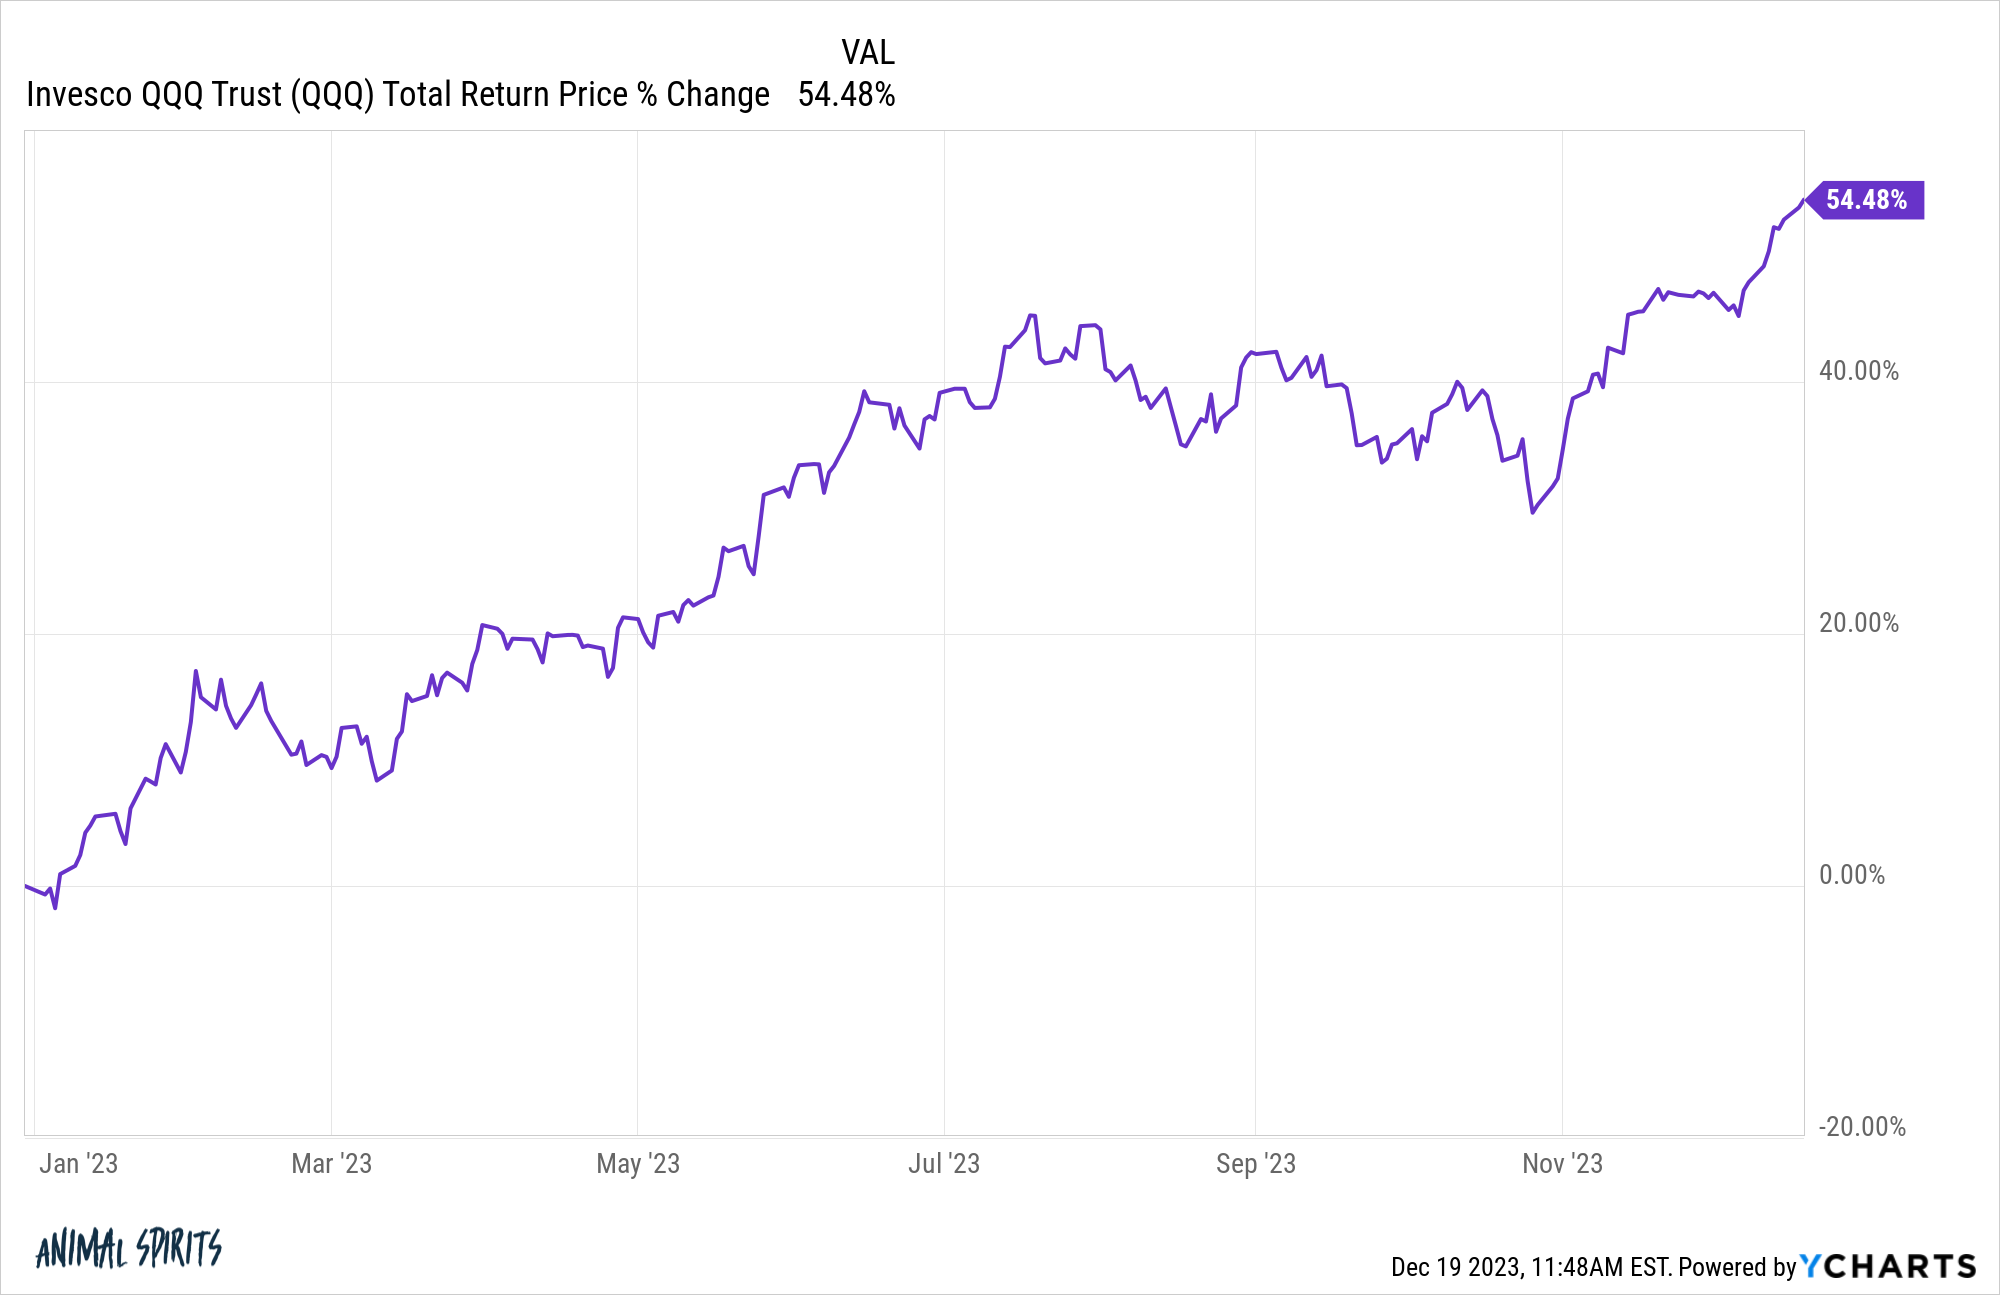
The tech-heavy index is on pace for its first half-century performance since 2009.
The Magnificent 7 stocks are a big reason for this year’s massive gains but it also helps that the Nasdaq crashed last year, falling more than 32%.
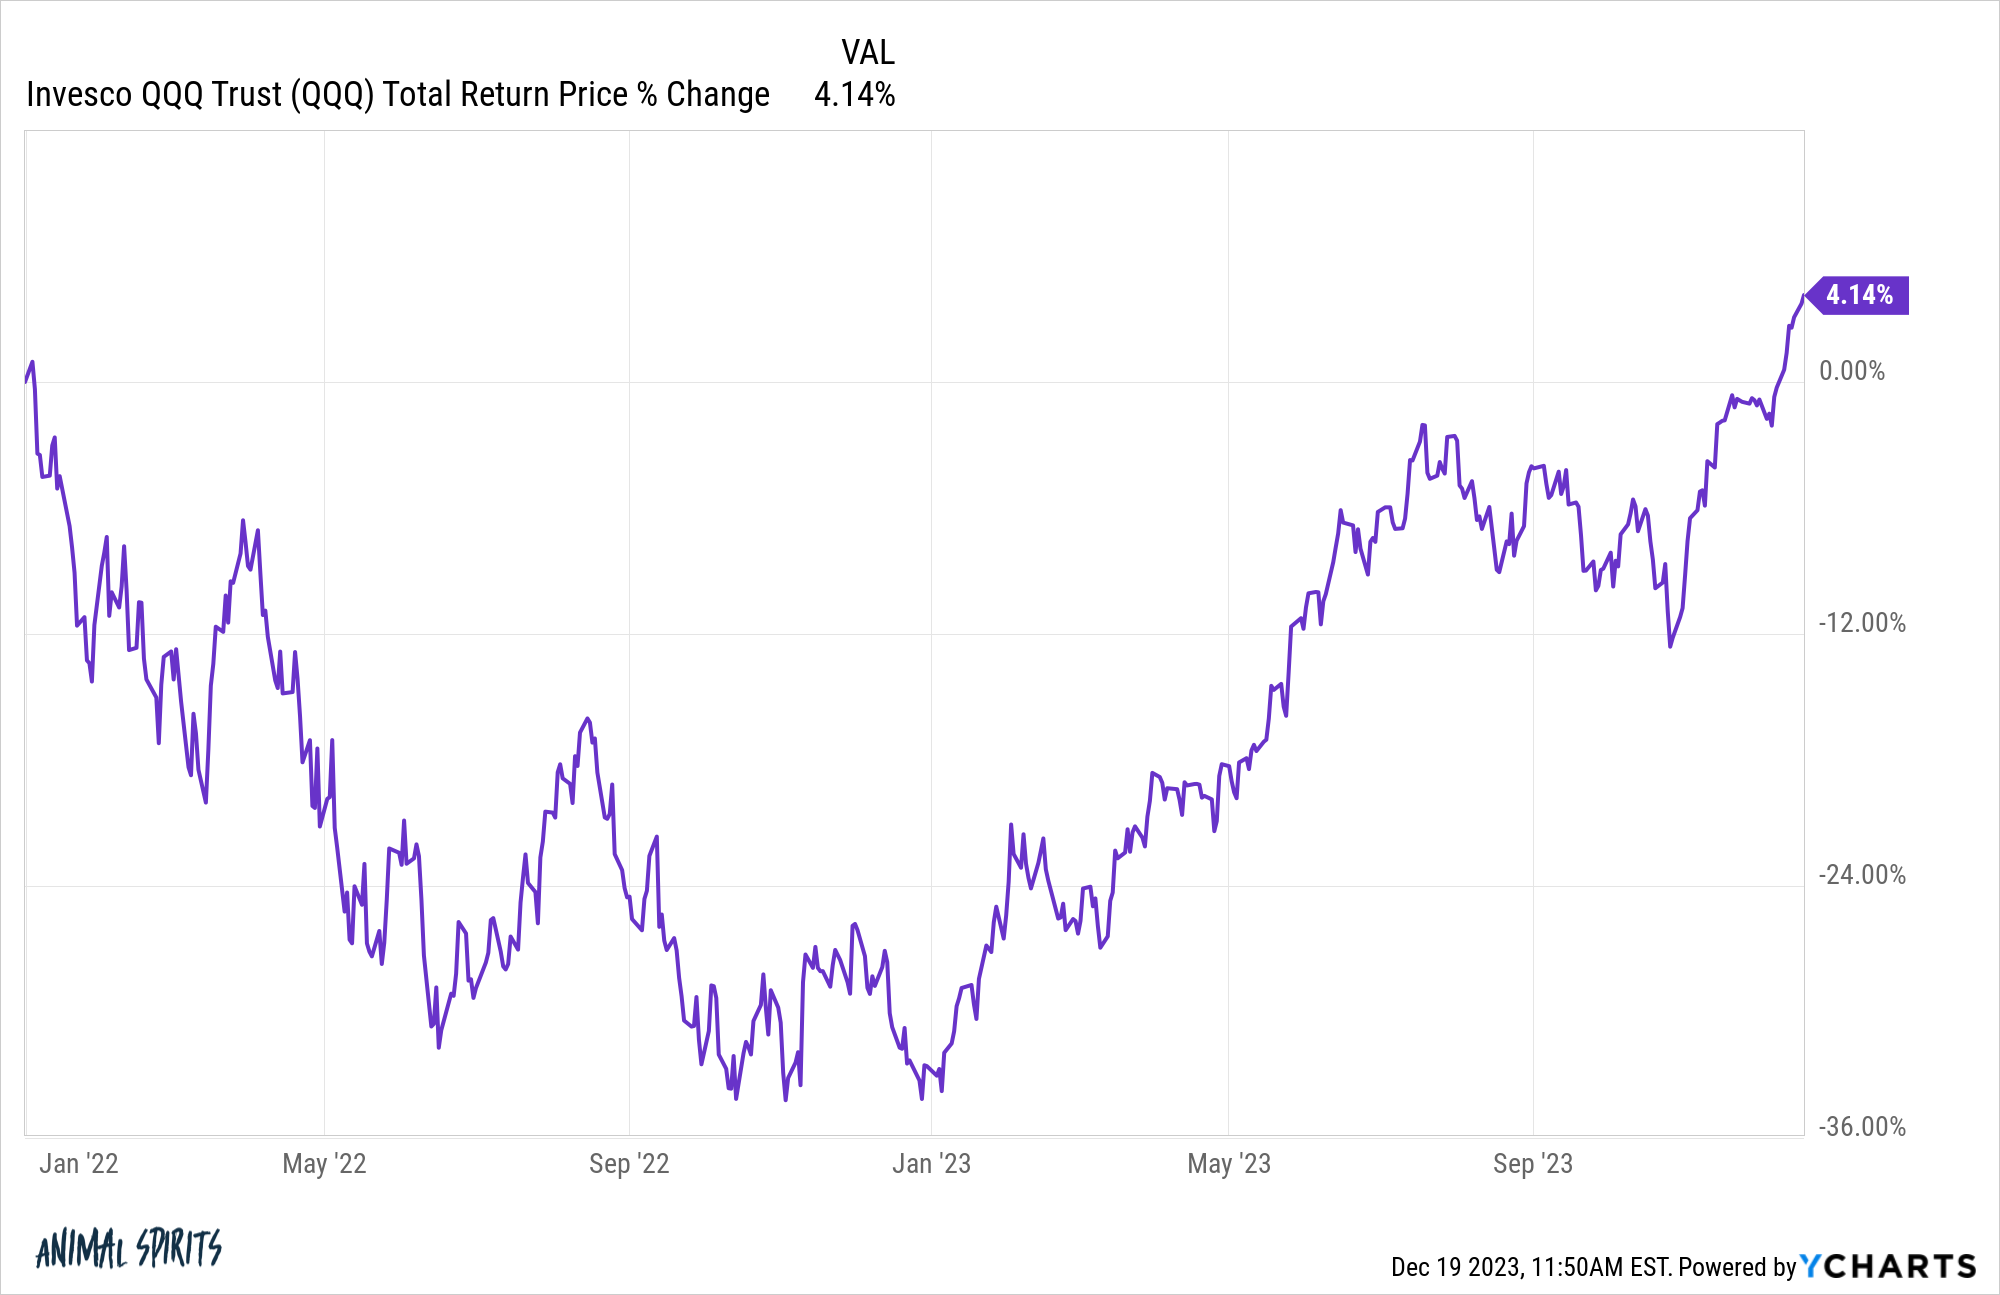
In fact, if you look at the total returns since the start of 2022, it’s only slightly positive:
It’s also true that large gains in this concentrated index have been the norm for quite some time now.
These are the annual returns since 2013:
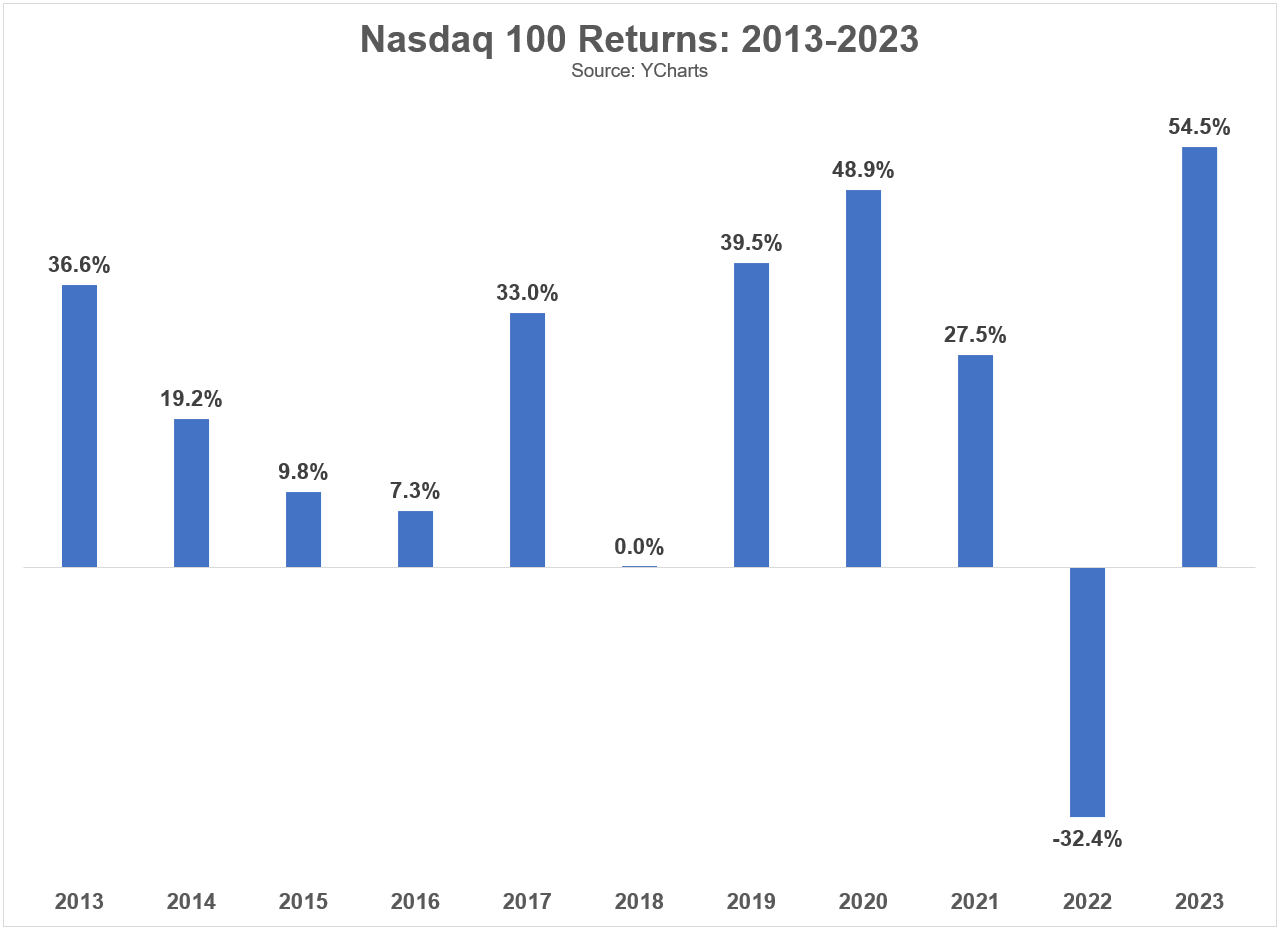
Five out of the past seven years have seen gains in excess of 25%. Four of those seven years were +30% or more. Eight out of the past eleven years have seen moves of double-digits in either direction (mostly to the upside).
Big gains and big losses are the norm for the Nasdaq, even more so than the rest of the stock market.
Take a look at the cycle of performance using some admittedly cherry-picked start and end years for the Nasdaq 100, S&P 500 and Russell 2000:
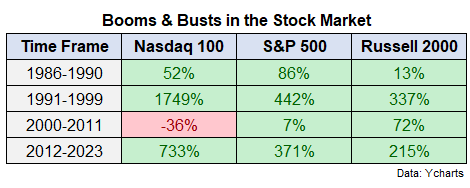
Everything is bigger in Texas the Nasdaq.
That run in the 1990s was otherworldly. You had 38% annual returns from 1991-1999 as the dot-com bubble ramped up. The other side of that insane run was an 83% crash when the bubble deflated along with negative returns from 2000 until some time in 2013.
The trade-off for nearly a decade of near-40% annual returns was going nowhere for almost a decade-and-a-half.
As always, risk and reward are attached at the hip.
You don’t get 19% annual returns since 2012 without the prospect for a lost decade-plus leading up to these wonderful returns.
A lot of people are worried about the concentration of the Nasdaq 100 and the enormous returns those stocks have experienced this cycle.
While the top 10 stocks in the S&P 500 make up roughly 30% of the index, the top 10 make up more like 50% of the market cap in the Nasdaq 100.
I’m sympathetic to the argument that mean reversion should play a role going forward. You can’t expect gains of nearly-20% per year to continue.
But the Nasdaq this century is a lot like mashing 2022 and 2023 returns together. Since the start of 2000, the Nasdaq 100 is up a pedestrian 6.4% per year. Again, that’s a cherry-picked start date at the height of a ginormous bubble but it’s important to look at a full cycle when gauging performance.1
I’m not confident in my ability to predict future market returns. There are simply too many variables at play.
I am more confident in the idea that investors in the Nasdaq 100 will experience higher highs and lower lows than the overall stock market when it comes to returns because of the concentration and types of stocks the index holds.
Risk is a lot easier to predict than returns.
If you want to earn the big gains you have to be willing to sit through the big losses.
Further Reading:
Power Laws in the Stock Market
1Since the first full year of performance for the Nasdaq 100 in 1986, the annual returns have been a spectacular 14% per year. That compares to roughly 11% annual returns for the S&P 500 since 1986.

