I’ve never been a big fan of financial jargon because most of the time it’s used to impress people rather than help them understand what you’re talking about.
Here’s a piece of jargon that never made much sense to me — fair value.
Our fair value of the S&P 500 is 4,357 based on blah, blah, blah.
Fair relative to what? Historical data? Other markets? Earnings? Sales? Free cash flow? Interest rates? Taylor Swift concert ticket prices?
The problem in trying to nail down fair value is there are so many different valuation measures to choose from.
Historical valuations. Robert Shiller has CAPE ratio data going back to 1871:
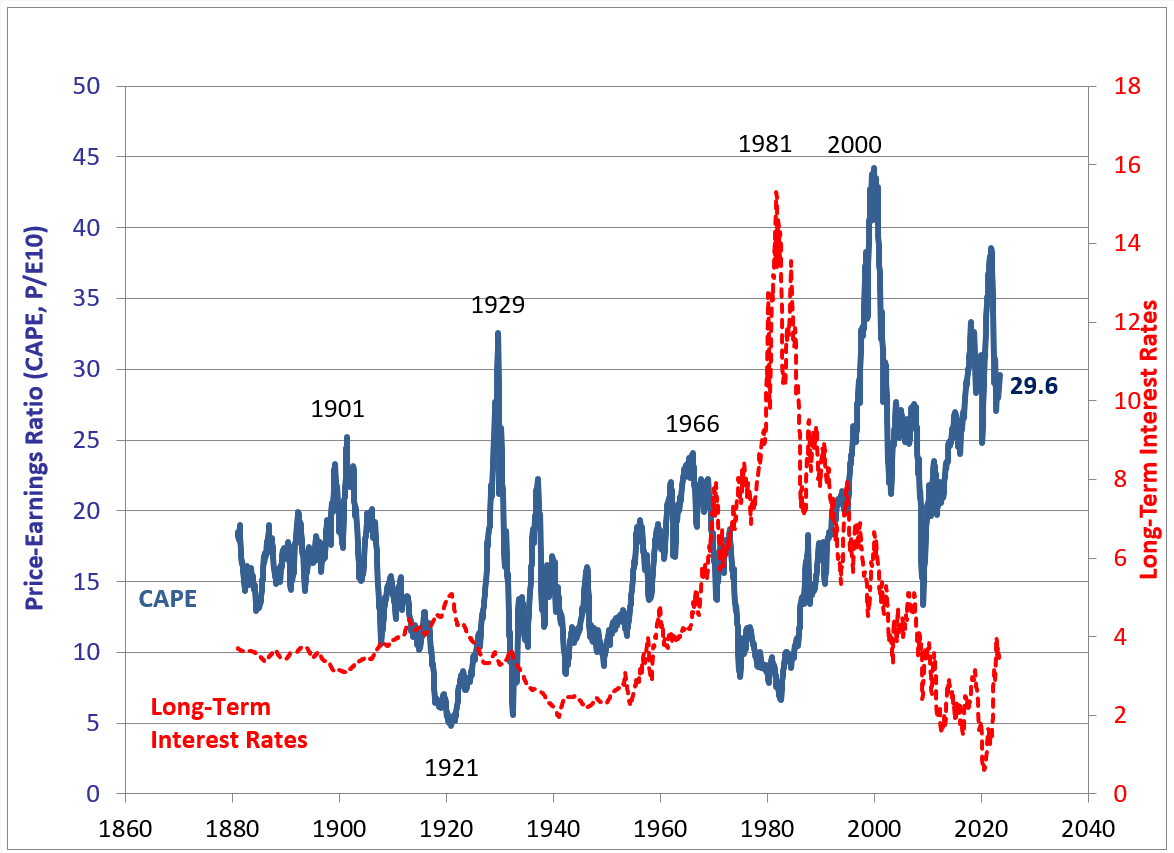
The current CAPE at nearly 30x inflation-adjusted trailing 10 year earnings certainly looks high relative to the 17.4x average if we go back to when Ulysses S. Grant was president.
But it’s not that much higher than the 27x average we’ve seen this century.
Each average is skewed in its own way. Valuations have been on the high side of history the past few decades while they were much lower before we had automobiles or personal computers.
Relative valuations to recent history. JP Morgan has a chart that looks at valuations on the U.S. stock market using a bunch of different measures — earnings, CAPE, dividend yield, price-to-book, price-to-cash flow and the spread between the earnings yield and corporate bonds:
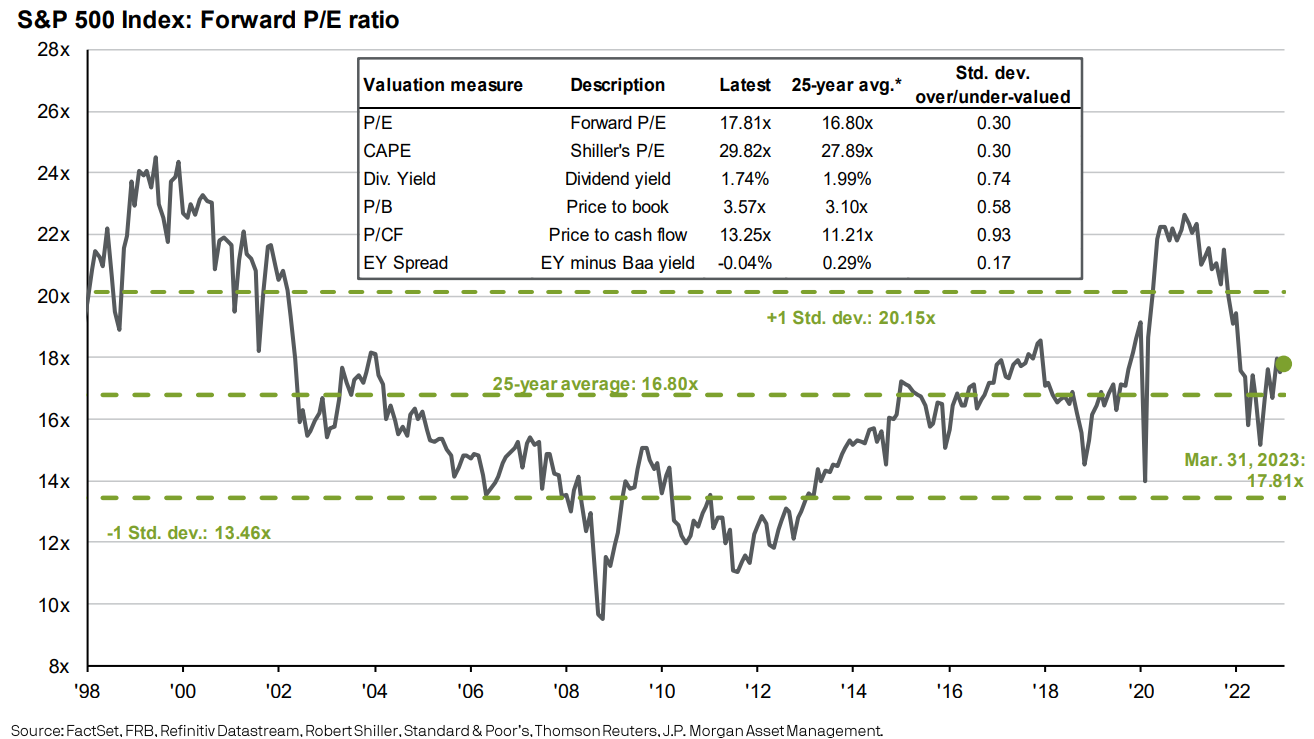
Things look a tad rich relative to the past 25 years but more or less in line with the averages.
JP Morgan also has a comparison of global valuations over the past 25 years:
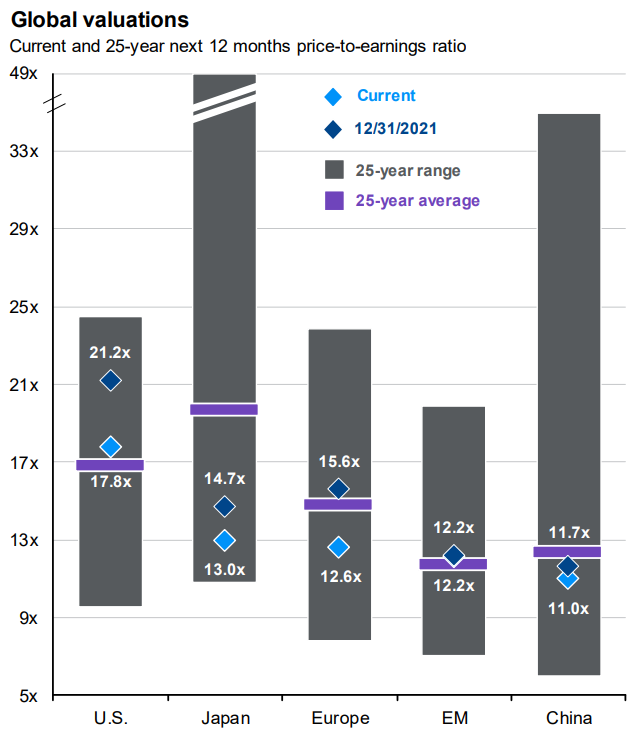
Looks like average in the U.S., China and emerging markets and relatively inexpensive in Japan and Europe.
We can also look at relative valuations between foreign stocks and U.S. stocks:
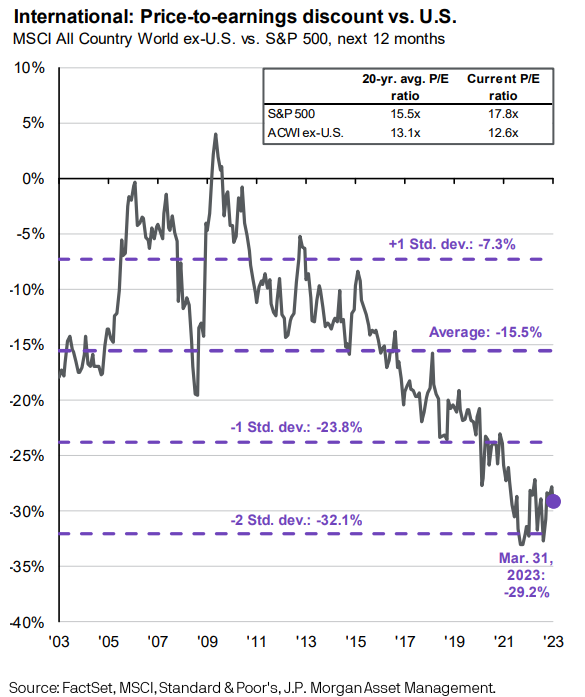
International stocks are cheap in comparison to the United States but it’s been that way for a while now.
Or how about growth versus value:
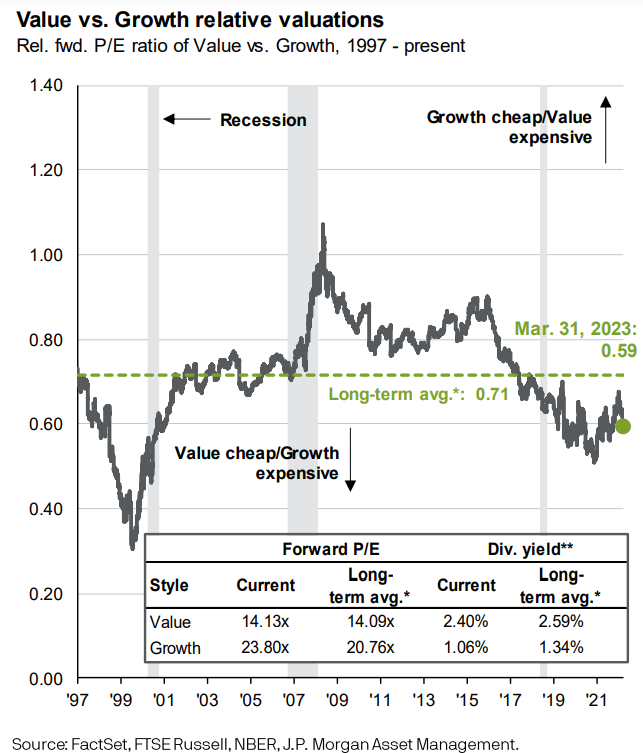
Value stocks are always cheaper than growth stocks but each group isn’t too far off historical norms.
And since we’re looking at various valuation metrics here it’s worth pointing out that there are all sorts of different ways to look at “value” and “growth” when it comes to stocks.
Confused yet?
Let’s keep going.
Forward-looking valuations. Yardeni Research has valuation metrics for mid caps and small caps as well going back to 1999:
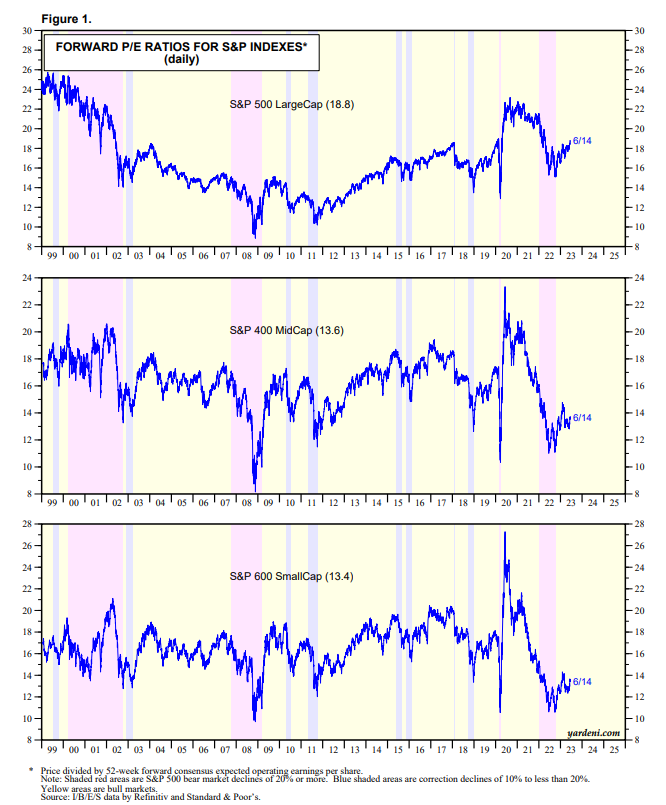
Based on forward P/E ratios that take into account earnings estimates, smaller and mid-sized corporations look a lot cheaper relative to their own history than large cap stocks at the moment.
Adjusted valuations. There are also various ways to adjust current valuations.
Many people assume tech stocks deserve a higher-than-market multiple because they are more efficient, require fewer employees and have higher margins than more capital-intensive businesses of the past.
Yardeni breaks down forward P/E ratios by S&P 500, technology stocks in the S&P and the S&P ex-tech:
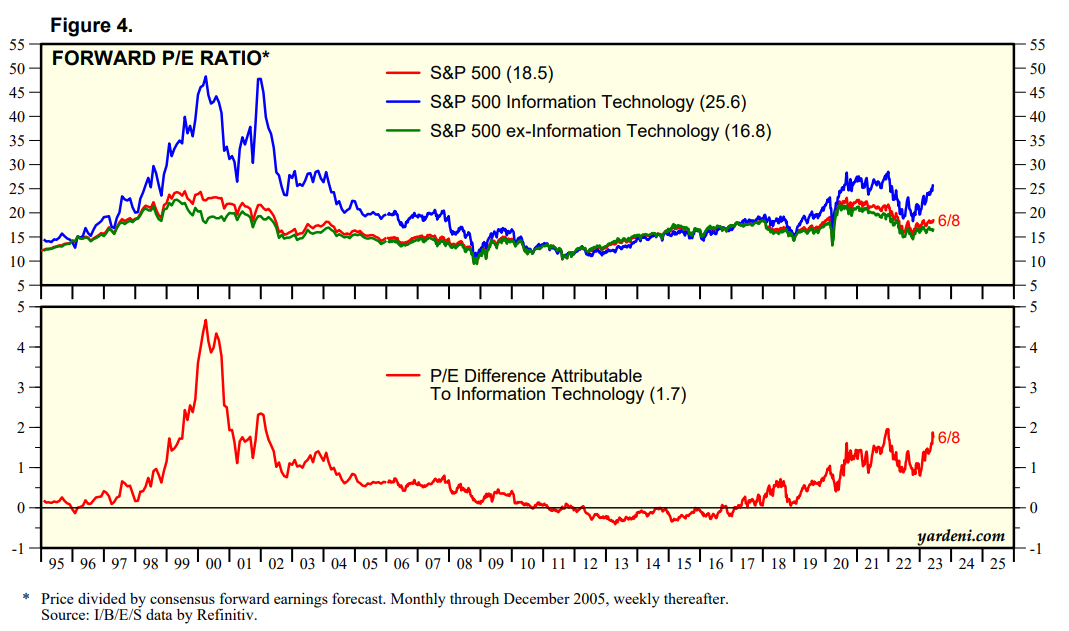
If you take out the tech sector stock market valuations don’t look too bad.
I guess it depends on how you feel about whether tech stocks deserve a premium or not. It makes sense to me at the moment but I have no idea what that premium should be or how long it should last.
But there is a case to be made that the rest of the market looks pretty cheap if you take out the relatively expensive tech names.
Relative valuations. This is the first time in nearly two decades that bonds have given stocks a run for their money in terms of yields.
T-bills, muni bonds and corporate bonds are now all yielding over 5%. That’s a much higher hurdle rate than the yields investors were used to seeing in the 2010s and early pandemic years.
The inverse of the forward P/E ratio of 18.8x would give us an earnings yield on the S&P 500 of 5.3%. The earnings yield is higher for mid caps (7.4%) and small caps (7.5%).
I’m not suggesting that earnings yields can accurately predict future returns. They can’t.
But the spread between what you can earn on bonds and what you can earn on stocks has compressed considerably over the past 15 months or so.
And the expected returns for bonds are much easier to forecast than the expected returns for stocks. Bonds are basically just their starting yield. Pretty simple.
There are so many other elements involved in future stock market returns that go beyond the fundamentals.
I could give you the dividend yield and future earnings growth rate for the stock market and it would still be nearly impossible to predict what returns are going to be since no one knows what investors are willing to pay for those earnings in the future.
The good news is it doesn’t seem like the stock market is egregiously overvalued at the moment. Some would even argue we’re trading at or near fair value but I’m not going to say that because I don’t like the phrase.
No one cares about 5% bond yields when the stock market is ripping higher by double digits. But I do think the prospect for yields to stay higher for longer could end up being the biggest headwind for stocks in the intermediate-term from here.
The good news for diversified investors is that we’ve gone from one of the worst years ever last year to a pretty good set-up so far this year.
The stock market is up double-digits. You can earn 5% in short duration, cash-like assets.
My advice is to enjoy it while it lasts.
Michael and I talked about stock market valuations and more on this week’s Animal Spirits video:
Subscribe to The Compound so you never miss an episode.
Further Reading:
Now here’s what I’ve been reading lately:
- How Dave landed Brad Pitt for the show’s season finale (Rolling Stone)
- What if we’re thinking about inflation all wrong? (New Yorker)
- Sharing memories about Ben Graham with Warren Buffett (Beyond Ben Graham)
- Why are houses so expensive? (Dollars & Data)
- What really happens when road space is reallocated from cars? (The City Fix)
- Time millionaires (A Teachable Moment)

