A reader asks:
Big fan of The Compound from Japan! My mother (59 yo now and will be retiring in 8 years) is one of those people who doesn’t believe in putting money in the stock market because she’s afraid to “lose it all” – there are a lot of people in Japan who are still traumatized from the stock market bubble collapse in the early 90s. Now she’s got about USD $300,000 in cash sitting in a checking account literally earning nothing. Earlier this year I was finally able to convince her to open a brokerage account and to invest some of her money, about USD $100,000. I manage this account for her and decided to allocate 60% of that into a target date fund (target 2030 and currently allocated 40% stocks/60% bonds) and 40% in an All World Stocks Index Fund. I chose this allocation because I want to believe that having an increasing allocation to bonds through the target date fund is prudent investing for someone her age but I’m constantly fighting an internal battle within me to allocate more to stocks so I can improve the return. She’s got no debt, expects a decent pension once she retires so this money is largely supplementary, should I ditch the prudence and allocate more to stocks?
I completely understand where your mother is coming from as it pertains to being nervous about financial assets if she’s looking at it from a purely Japanese perspective.
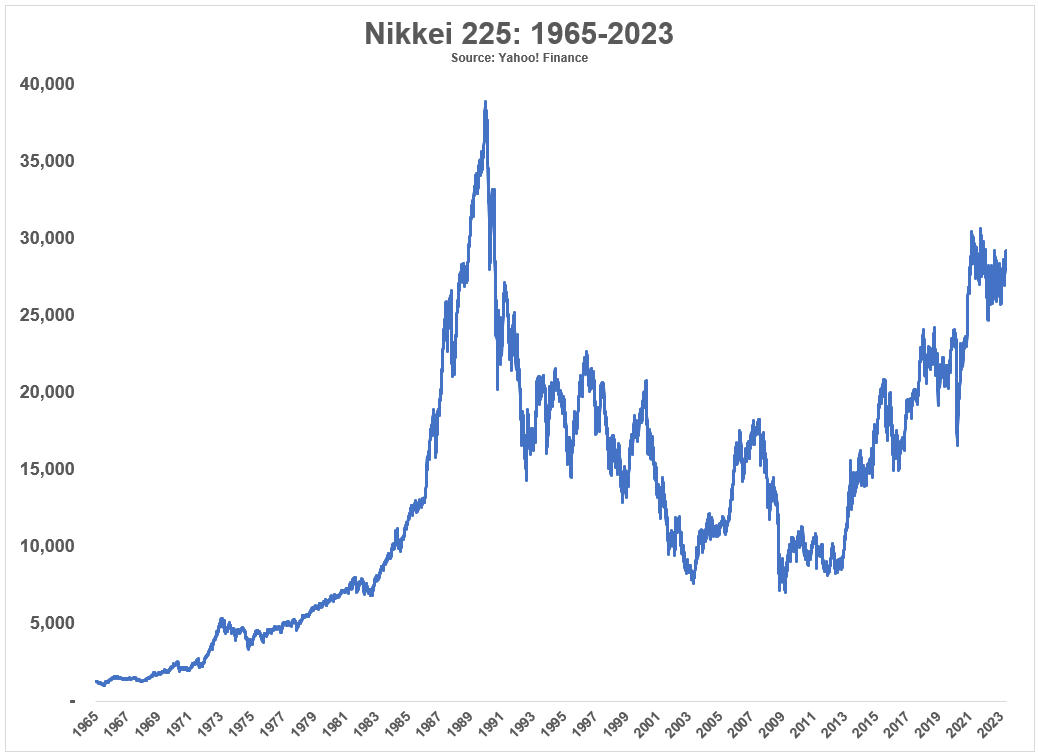
One dollar invested in the MSCI Japan Index in 1990 grew to just $1.32 by the end of April this year
Plus, that dollar was underwater for almost 30 years!
One dollar invested in the S&P 500 on the other hand, would have grown to more than $23 in that same timeframe.
We’re talking annual returns of 10% per year in US stocks versus returns of around 0.85% per year for Japanese equities.
And that’s from the perspective of a U.S. investor. Things were even worse from the perspective of an investor in Japan:
Why did this happen?
For my money, Japan had the biggest financial asset bubble in history in the 1980s.
There aren’t all that many books written about the Japan bubble and its aftermath but my favorite description was a chapter in Edward Chancellor’s Devil Take the Hindmost, which is one of the best books ever written about financial manias and crashes.
Here are some of the best facts and figures from that book as well as other tidbits I’ve picked up over the years:
- From 1956 to 1986 land prices in Japan increased by 5000% even though consumer prices only doubled in that time.
- By 1990 the Japanese real estate market was valued at 4x the value of real estate in the United States, despite being 25x smaller in terms of landmass and having 200 million fewer people.
- Tokyo itself was on equal footing with the U.S. in terms of real estate values.
- The grounds on the Imperial Palace were estimated to be worth more than the entire real estate value of California or Canada at the market peak.
- There were over 20 golf clubs that cost more than $1 million to join.
- In 1989 the P/E ratio on the Nikkei was 60x trailing 12 month earnings.
- Japan made up 15% of world stock market capitalization in 1980. By 1989 it represented 42% of the global equity markets.
- From 1970-1989, Japanese large cap companies were up more than 22% per year. Small caps were up closer to 30% per year. For 20 years!
- Stocks went from 29% of Japan’s GDP in 1980 to 151% by 1989.
- Japan was trading at a CAPE ratio of nearly 100x which is more than double what the U.S. was trading at during the height of the dot-com bubble.
Sheer insanity.
Japan had a simultaneous bubble in both real estate and stocks.
There are people who are too scared to invest in the U.S. stock market and the returns here have been fantastic. Things got so out of whack in Japan that prices have basically gone nowhere for 3 decades.1
Japan is certainly an outlier when it comes to terrible financial asset returns over the past 3-4 decades but the U.S. has experienced this kind of stock market malaise before as well.
Imagine living through the Great Depression and World War II as a stock market investor:
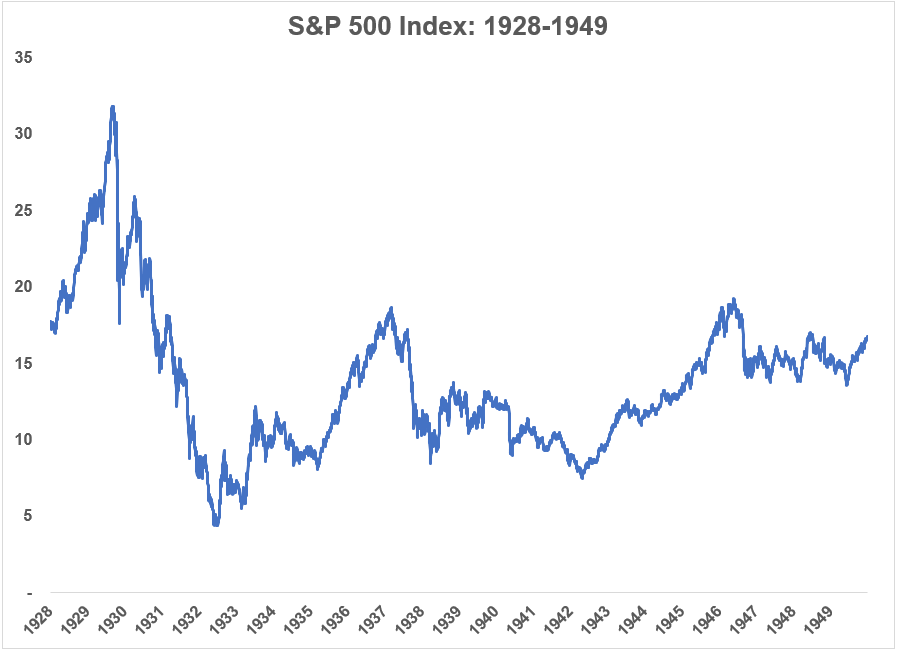
Stocks for the long run my derriere.2
People had all but given up on the stock market by that point.
So it’s understandable why an older person in Japan who lived through that boom and bust would have some deep scars.
The big question is: How do you get someone to change their psychology when it comes to the stock market?
There are no easy answers here.
You could walk them through historical rates of return, interest rates, inflation rates, compound interest, earnings, dividends and the like but charts and figures probably aren’t going to be much help.
As much as I like numbers, they don’t move the needle when it comes to changing people’s minds about emotional subjects. And money is full of emotional baggage, bubbles or not.
I would lean into the emotions here since numbers alone aren’t enough to change behavior.
Remember the scene in Shawshank when Andy asks Captain Hadley if he trusts his wife:
It was a gutsy move by Dufrense but it worked. You might want to ask your mother the same thing.
Mom, do you trust me to handle your finances and invest them in a prudent manner?
You also have to ask her what the money is being used for in the first place.
Is it going to supplement her pension income?
Will she even need the money?
Will some of it be passed down to her children or possibly grandchildren?
I would appeal to her emotions rather than the math of it all.
Keep things simple, low cost, long-term and match her goals with her risk profile and time horizon.
We discussed this question on the latest edition of Ask the Compound:
Our resident tax expert Bill Sweet joined the show once again to talk about questions on saving for a down payment, SEP IRAs, rollover IRAs, Roth IRAs and offsetting capital gains and losses.
Further Reading:
How the Stock Market Works
1If you go all the way back to 1970 the returns for Japanese stocks are still pretty respectable at 8.6% per year, which shows how crazy the run-up in the 1980s was.
2To be fair, this chart is price only. With dividends the total returns were +170% (+4.7% annually) from 1928-1949. Not great but not bad all things considered. And the 1950s ushered in one of the biggest bull markets of all-time.

