In a recent piece I looked back at the worst years in stock market history because, well, so far this is one of the worst years in stock market history.
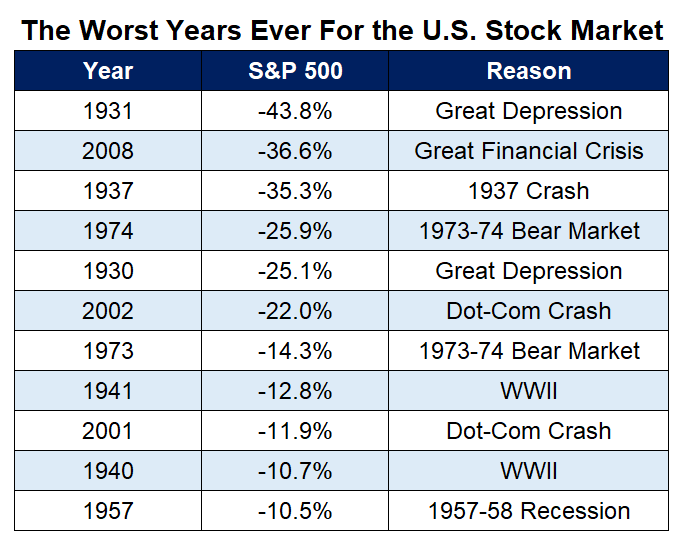
If the year ended now, we would be somewhere between 1973 and 1941.
As many of my astute readers pointed out, the logical follow-up here is to look at the worst years for a more diversified portfolio to see the worst-case scenario for a 60/40 portfolio.
Let’s look at the worst calendar year returns for a U.S. 60/40 portfolio1 going back to 1928:
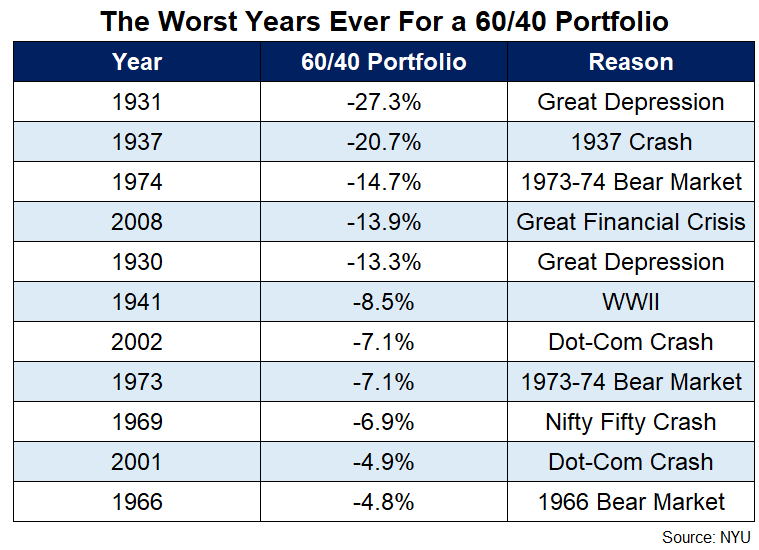
Many of the worst years for a 60/40 portfolio are the same as the worst years for the U.S. stock market, which makes sense since the 60 carries much more risk than the 40 in this equation.
And while the current 13% and change loss in the S&P 500 year-to-date would be the eighth-worst calendar year return since 1928, it’s even worse for the 60/40 right now.
If the year were to end today, the current year-to-date return of -12.1% for a 60/40 portfolio would be the sixth-worst annual return over the past 100 years or so.
Since bonds are having such a rough go at it during a correction in the stock market, this year is currently on par with 60/40 returns in 2008 and 1930.
Not the kind of company you want to keep.
Of course, we’re only 5 months into the year. And even if the year were to finish where we are right now (or worse), it’s just one year.
You should expect to have bad years when investing because investing is not always easy in the short-term.
What about the longer-term returns (the only ones that really matter)?
These are the worst 5 year returns for a 60/40 portfolio:
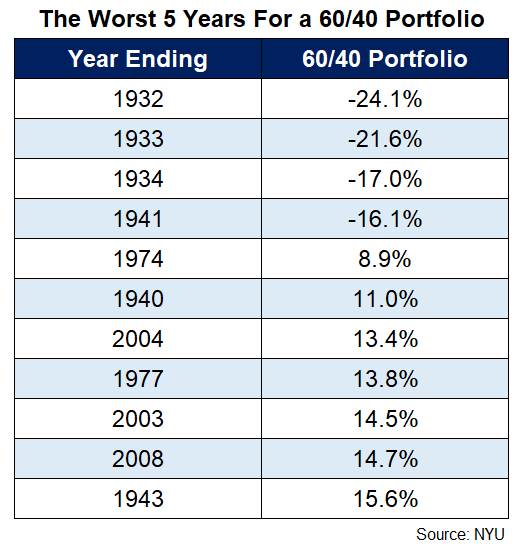
So we’re looking at four times over a 5 year period when 60/40 was negative over 5 years and they all occurred in or around the Great Depression.
Now let’s go out 10 years:
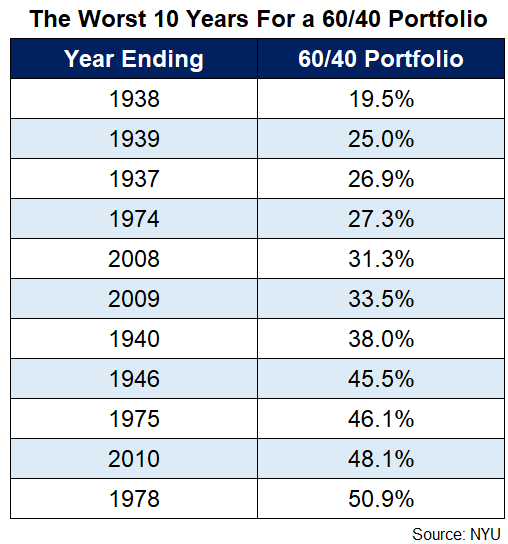
By my calculations, there has never been a negative return over 10 years for a 60/40 portfolio as of a calendar year-end.
Could it happen?
Absolutely.
There is no such thing as always or never in the financial markets.
Still, that’s a pretty decent track record.
How about one more?
Here are the worst 20 year returns:
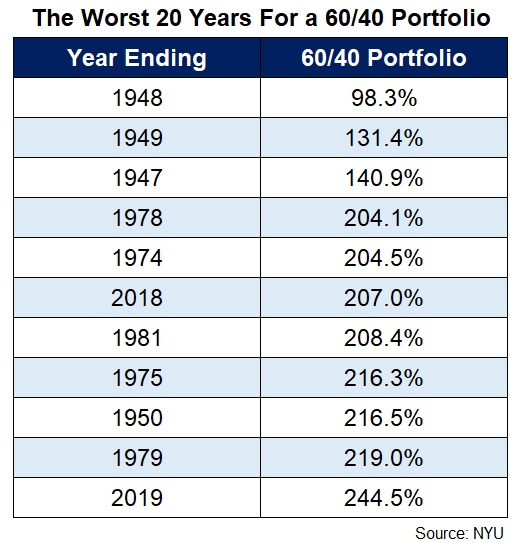
As with most worst-case historical performance numbers, the starting point for the bottom of the barrel was 1929.
It is interesting the years ending 2018 and 2019 are on this list. The height of the dot-com bubble was not a terrific entry point either.
It’s worth pointing out that the range of annual returns for the worst 20 years listed here for a 60/40 portfolio is 3.4% to 6.0%.
I’m not accounting for fees or taxes or inflation here but this is still pretty good for a worst-case scenario, right?
I wonder how many investors would sign up for a guaranteed 6% per year for the next 2 decades right now.
Past performance is not indicative of future returns and all that but sometimes it is helpful to zoom out a little bit when you’re in the midst of a terrible year.
Extending your time horizon remains one of the most powerful investment strategies when all else fails.
Further Reading:
The Worst Years Ever in the Stock Market
1The 60/40 portfolio here is 60% in the S&P 500 and 40% in 10 Year Treasuries via data from NYU that I use regularly. All of the returns in this post are calendar year-end performance numbers.

