The 35 year period from 1930 to 1964 produced a total return of 2234% or 9.4% on an annual basis for the S&P 500 index.
The 35 year period from 1965 to 1999 produced a total return of 5947% or 12.4% on an annual basis for the S&P 500 index.
The 19 year period from 2000 to 2018 produced a total return of 147% or 4.9% on an annual basis for the S&P 500 index.
One of these things is not like the others.
To put this into perspective, for the 35 year period from 2000-2034 to earn the same return as the 1930-1964 time frame, the S&P 500 would need to earn roughly 15% per year from 2019-2034.
For the 2000-2034 period to earn the same 12.4% annual return as the 1965-1999 performance, it would have to see 22% annual gains over the next 16 years.
I’m not a gambling man but I think I’d take the under on this one.
In short, the nosebleed valuation levels stock reached in the late-1990s could prove to be the worst entry point in stock market history.
Obviously, the market got cut in half from 2000-2002 and again from 2007-2009. When looked at from this perspective, close to a 5% annual return actually isn’t that bad, especially when you factor in that the CAPE ratio topped out at the end of 1999 at more than 44x the average of the trailing 10 years’ earnings. The inverse of that P/E ratio would have been an earnings yield of just 2.3%.
I’m also having some fun with numbers here by choosing such a terrible starting point. The 35 year annual return from 1984 to 2018 was a total of 3433% or 10.7% annually. So even with the 1987 crash, dot-com blow-up, and Great Financial Crisis, this period has still given investors double-digit returns.
In fact, going back to 1926, the 35 year annual return on the S&P 500 has never fallen below 8%:
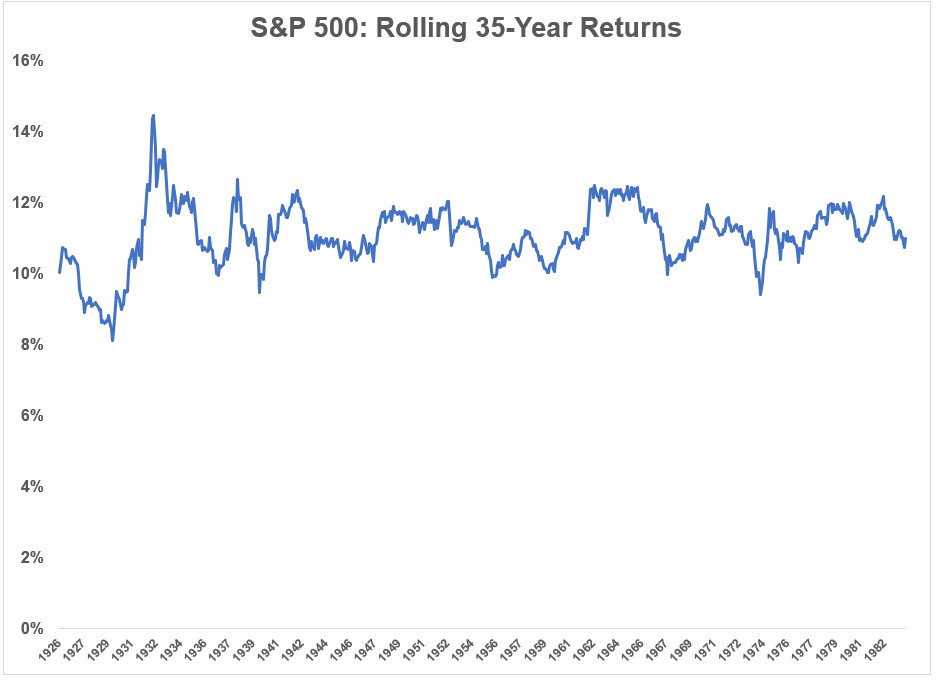
The years on the bottom of the graph correspond with the starting year for the ensuing 35 year period. The worst entry point for the next three-and-half decades was unsurprisingly September 1929. But even investing at the peak of the market in 1929, just before the greatest crash in U.S. history, stocks still returned 8.1% over the next 35 years.
For stocks to reach that 8.1% annual return level for the 35 year period from 2000-2034, the S&P would need to show an annualized gain of around 12% a year over the next 16 years. Never say never, but this seems like a stretch considering how well the past 10 years have gone. We would basically need a repeat of the 1990s to get there.
So it looks like the year 2000 will go down as by far the worst entry point in the U.S. stock market over the past 100 years or so, eclipsing even the peak of the market before the ~85% decline in stocks that began in 1929.
However, it is worth pointing out these numbers assume reinvestment of dividends to get those total returns. Most people didn’t, or more likely, couldn’t reinvest their dividends back then. It’s also true that the cost of investing was substantially higher for the bulk of this time frame. So while gross returns in the modern landscape may look much lower than they did in the past, after all costs, fees, and spreads are taken into consideration, today’s returns may not be as bad on a net basis in comparison.
You also have to remember that no one put every dollar they had into an S&P 500 index fund on January 1, 2000. Most people slowly invest their money periodically over time. They also own other asset classes, geographies, and strategies.
The worst case scenario should not be the way you judge the long-term viability of an asset class, just as you should never assume the best case scenario is the norm.
Further Reading:
Trading Costs & New Market Averages
(Hat tip to reader Joe Kurtz for the idea on this one.)
Now here’s what I’ve been reading lately:
- A $5 trillion misunderstanding (KC ROI)
- Lessons from building a successful podcast (Nerd’s Eye View)
- The 5 stages of financial progress (Humble Dollar)
- Numbers are not reality (Irrelevant Investor)
- The art of not caring (Collaborative Fund)
- We’re all addicted to something (Ramp Capital)
- How to get your money in order before age 30 (UChicago Magazine)
- What credentials does it take to become a financial advisor? (Belle Curve)
- Bill Gates on 10 breakthrough technologies for 2019 (MIT Tech Review)

