I’ve spent a lot of time here looking back at historical bear markets in terms of length and magnitude.
Maybe it’s just reassuring to know bear markets do come to an end even if you don’t know when it will be.
This is every bear market since WWII along with the number of months they lasted peak-to-trough and then how long it took to make your money back from the bottom:
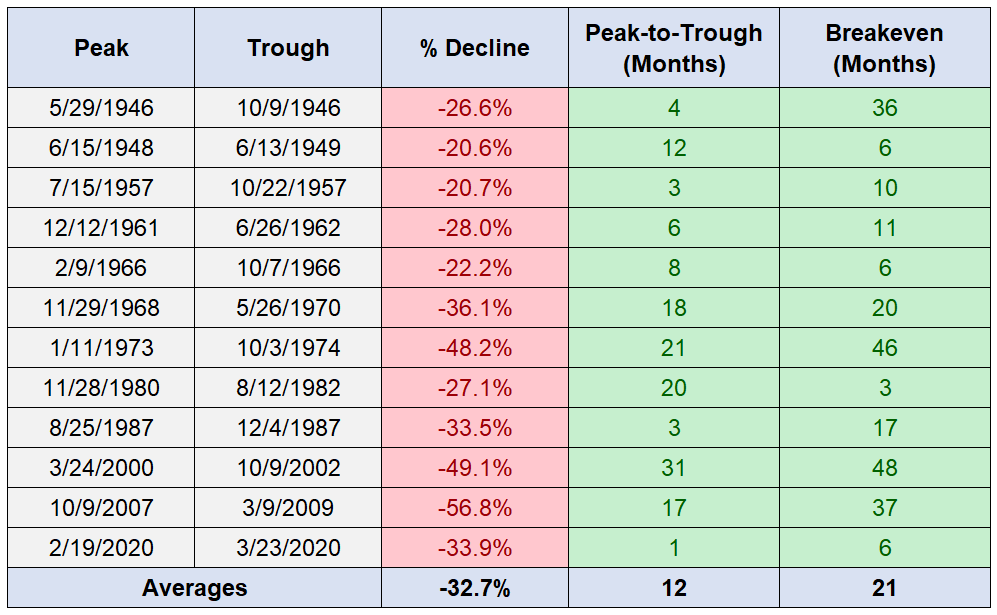
Add it all up and the average bear market has lasted a year and then taken nearly two more years to breakeven.
Some are longer and some are shorter.
But there’s another way to look at this.
When those peaks happened no one knew for certain the market was going to fall 20% and go into a bear market.
No one knew for sure it was going to happen this time around either but here we are.
Now that we’re in a bear market (officially as of the close on Monday), we can ask a different question:
How much longer do bear markets last once stocks are already down 20%?
This is a look at how long it has taken for the market to reach the 20% drawdown threshold and then how long it took to reach the bottom:
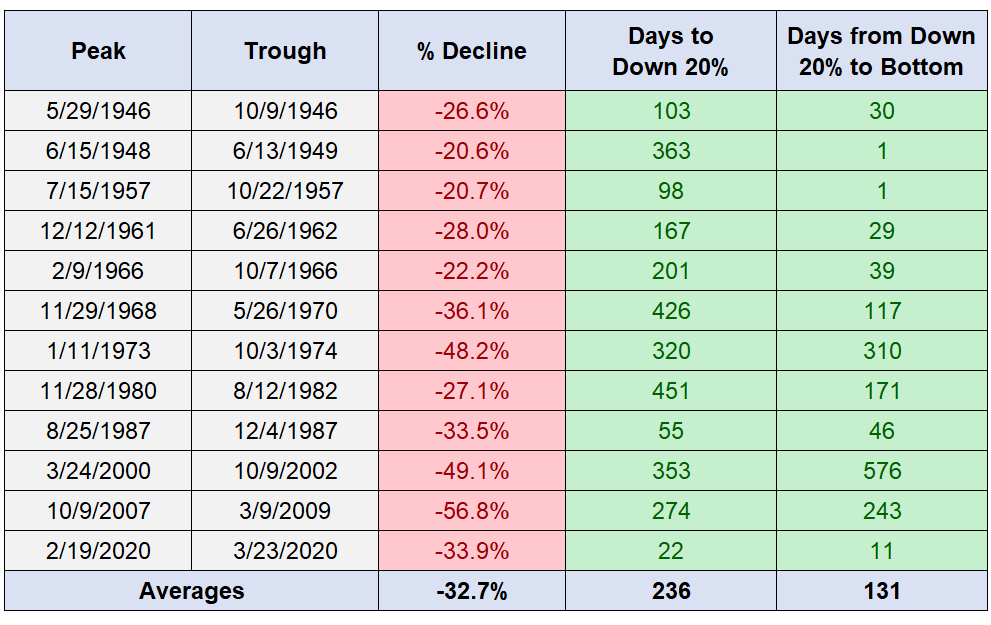
The good news is it typically takes much longer to reach 20% losses than the bottom, which makes sense when you consider not every bear market goes to the extremes.
The best-case bear market scenarios would be the 1948-49 and 1957 downturns that hit 20% losses and immediately bottomed.
The good news here is that 7 out of the last 12 bear markets have bottomed in 46 days or less once the 20% level was breached. And 5 out of the 12 were over in a month or less.
The other side would be 1973-74 which took 10 months to bottom once the bear took hold. The 2000-2002 crash took nearly 19 months until the nadir. The 2009 bottom was 8 months later.
As always you can find historical data that makes you feel better or worse about the current situation.
How about one more stat just for fun?
We already know it’s taken an average of 21 months for the last 12 bear markets to breakeven from the bottom.
Unfortunately, we don’t know when the bottom will be reached this time around.
So how long has it taken to breakeven once stocks are down 20%?
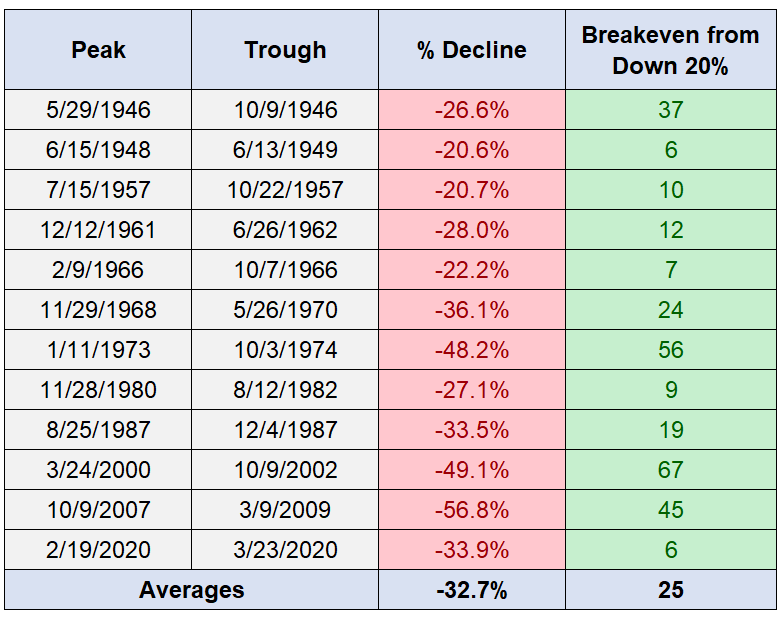
Now we’re looking at just over 2 years to make back your losses.
The bad news is this bear market could fall even further.
The good news is expected returns to simply breakeven from here are pretty good.
The S&P 500 is currently down 23.4% from all-time highs. This means the market would have to rise around 30% to breakeven.
If it took two years to make up the lost ground that would be annualized returns of 14%. If it took three years that would be 9% annual returns.
If we hit the average bear market of the past 80 years or so and end up down 33%, that would require a gain of around 50% to breakeven.
The bigger the loss, the bigger the gain needed to make it back.
A 50% return in two years would be 22% per year. Over 3 years it would be 14% annualized. Even if it took four years, that’s still 11% returns per year.
Not bad, right?
I don’t know how much longer this bear market will last and I don’t know how long it will take to get back to new all-time highs.
I’m not certain but I am confident those new highs are coming again at some point.
If not, what’s the point of investing in the first place?
Further Reading:
My Bear Market Survival Guide

