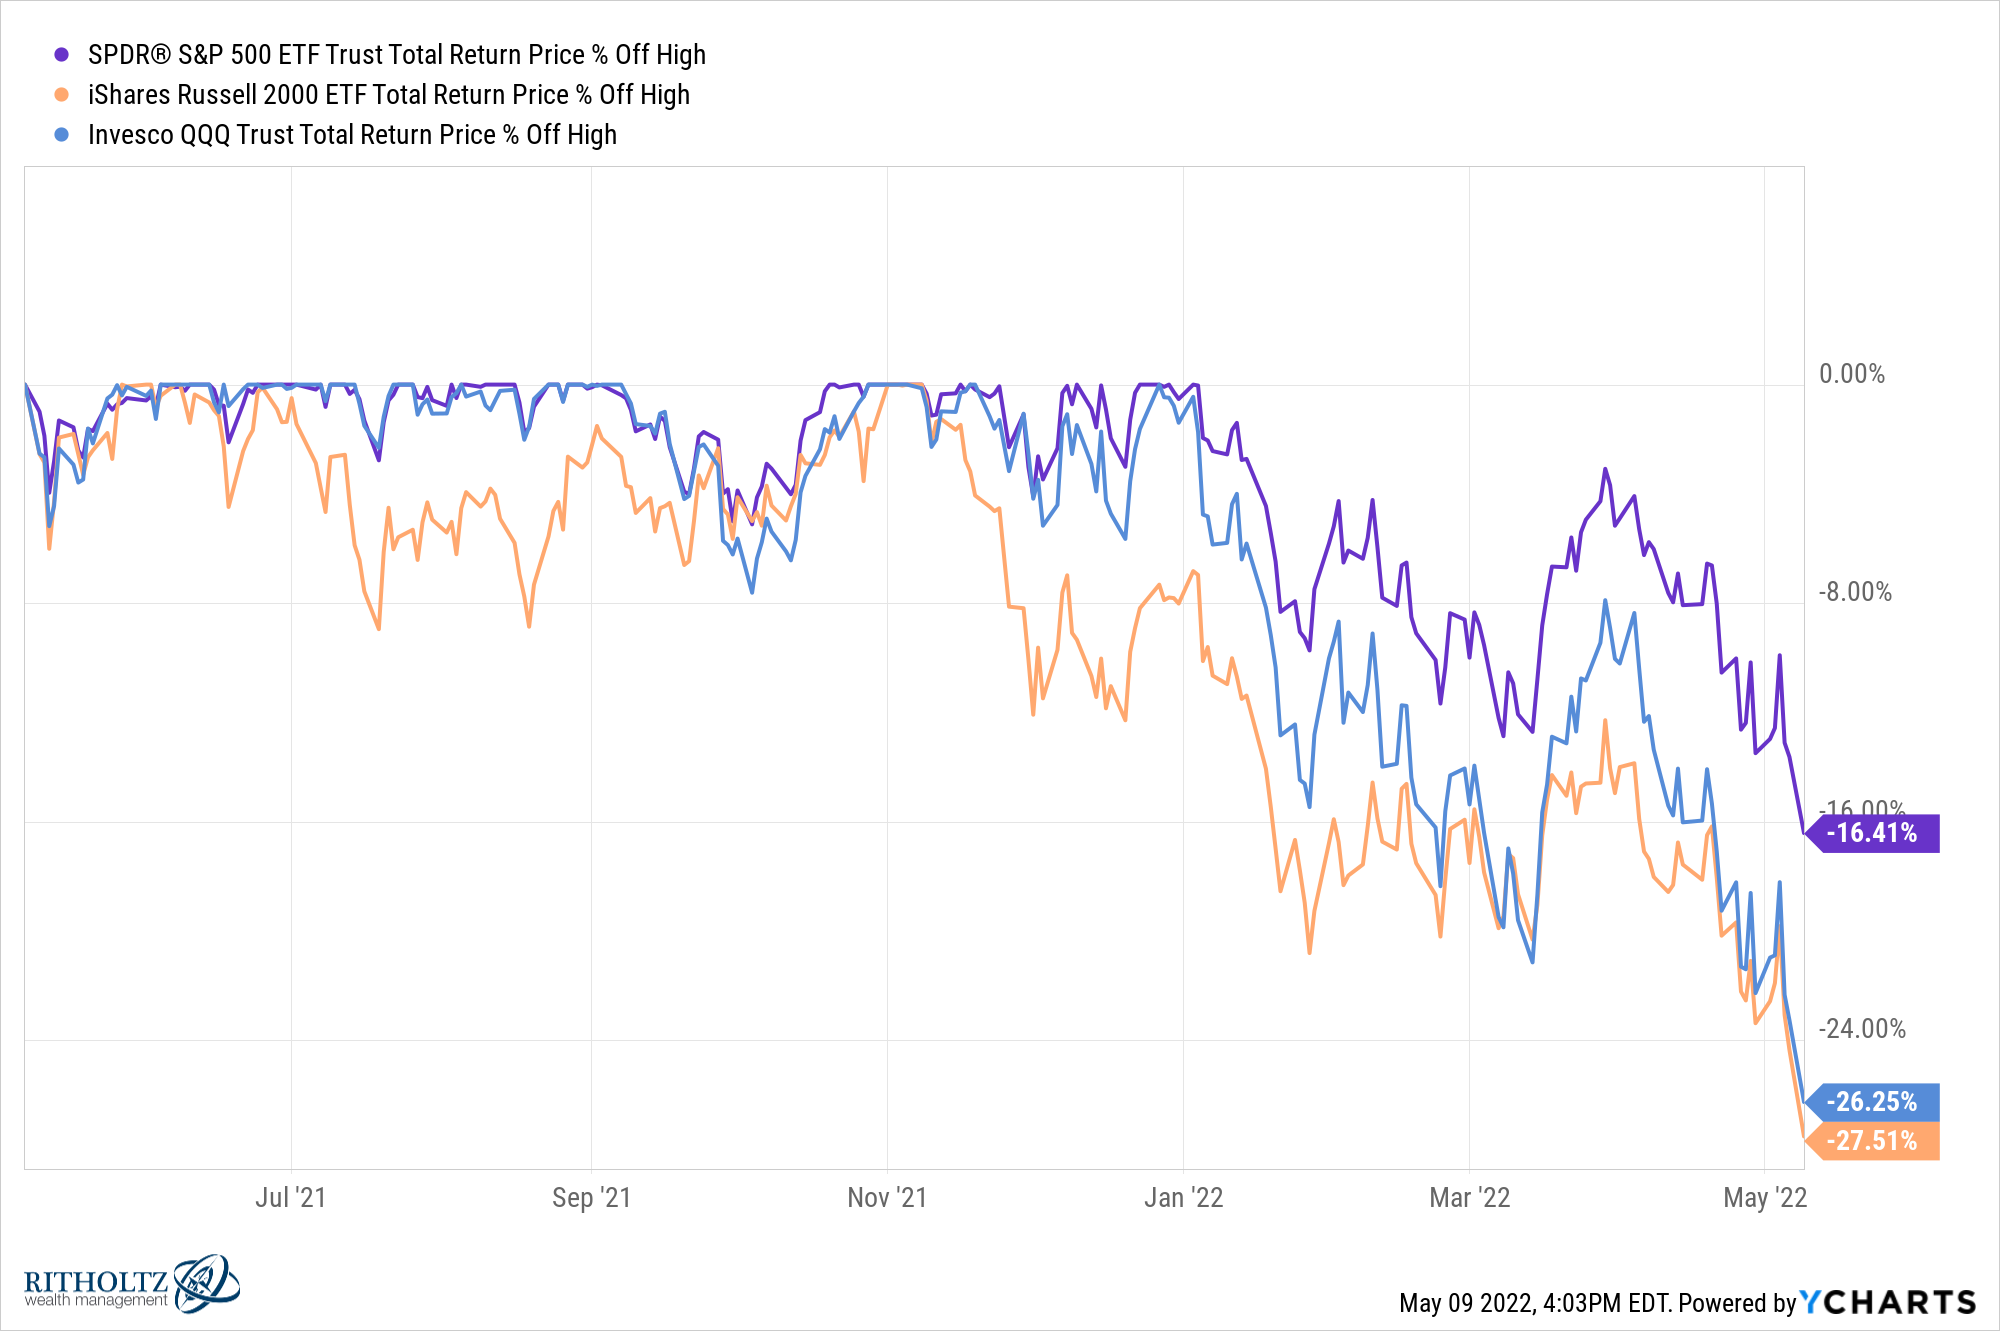
As of the close on Monday the S&P 500 is now down almost 17% from all-time highs.
The technical definition of a bear market is down 20% but we’re close enough for me to call it.
It’s a bloodbath out there.
The Nasdaq 100 and Russell 2000 are both already there:
It’s been a couple of years since we’ve experienced a bear market so it’s probably a good time for a refresher:
- Bear markets are normal.
- They can be painful.
- The reasons are always different but the emotions are the same.
- No one knows how long they will last.
- They do come to an end eventually.
The length of the current iteration probably depends on how long inflation stays elevated, how resolute the Fed is with tighter monetary policy and if these two factors combine to throw us into a recession.
Things could surely get worse before they get better or this could all end with one sentence from Jerome Powell if he decides to tap out. The bottom will look obvious in hindsight but, as always, predicting these things in real-time is not easy.
Historical comparisons cannot provide the blueprint for the present situation but they can help put things into perspective in terms of the length and duration of past bear markets.
Here’s a look at every bear market for the S&P 500 going back to 1950 that shows the drawdown, peak-to-trough number of days they lasted, and how long it took for the S&P to reclaim previous levels:
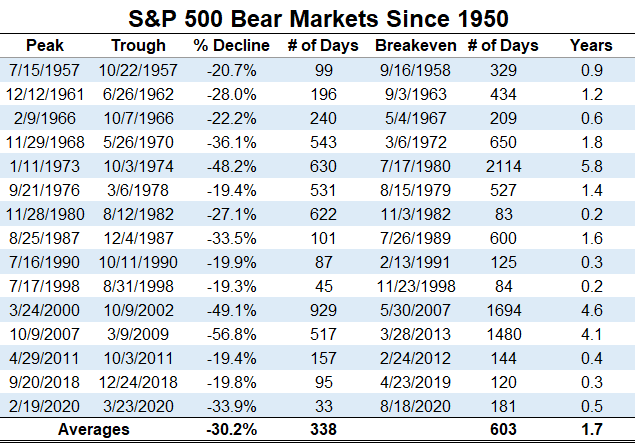
Over 15 bear markets, the average downturn is a loss of 30%, lasting just under a year to reach the bottom and taking a little more than one-and-a-half years to break even.1
The last three bear markets2 have all been relatively short-lived. Eight out of the 15 bear markets broke even in under a year. The worst-case scenario is the 1973-1974, 2000-2002 and 2007-2009 crashes which all took more than four years to recover.
I’m not sure how this one will play out.
Every time stocks fall a little it feels like they could fall a lot. Every time stocks go into a correction, it feels like they could go into a bear market. And every time stocks go into a bear market, it feels like they could tailspin into an all-out crash.
I certainly wouldn’t rule out a crash right now with how quickly markets are moving. It feels like the odds of something like a flash crash are much higher now than they were in the past.
The bad thing about bear markets is you never know how bad they’re going to get because we human beings can panic under duress.
The good thing about bear markets is they come to an end and offer the opportunity to buy at lower prices.
Successfully navigating a bear market requires patience and a good handle on your emotions and time horizon.
Further Reading:
What Happens When You Buy Stocks in a Bear Market?
1If you’re someone that prefers median values, here you go: -27.1%, 196 days, 329 days and 0.9 years, respectively.
2I rounded up on some of these. Horseshoes and hand grenades — close enough.

