One of the benefits of producing content on financial markets for an extended period of time1 is that you’re bound to see certain topics or environments that you’ve already covered.
For example, many market prognosticators are now worried about an inverted yield curve.

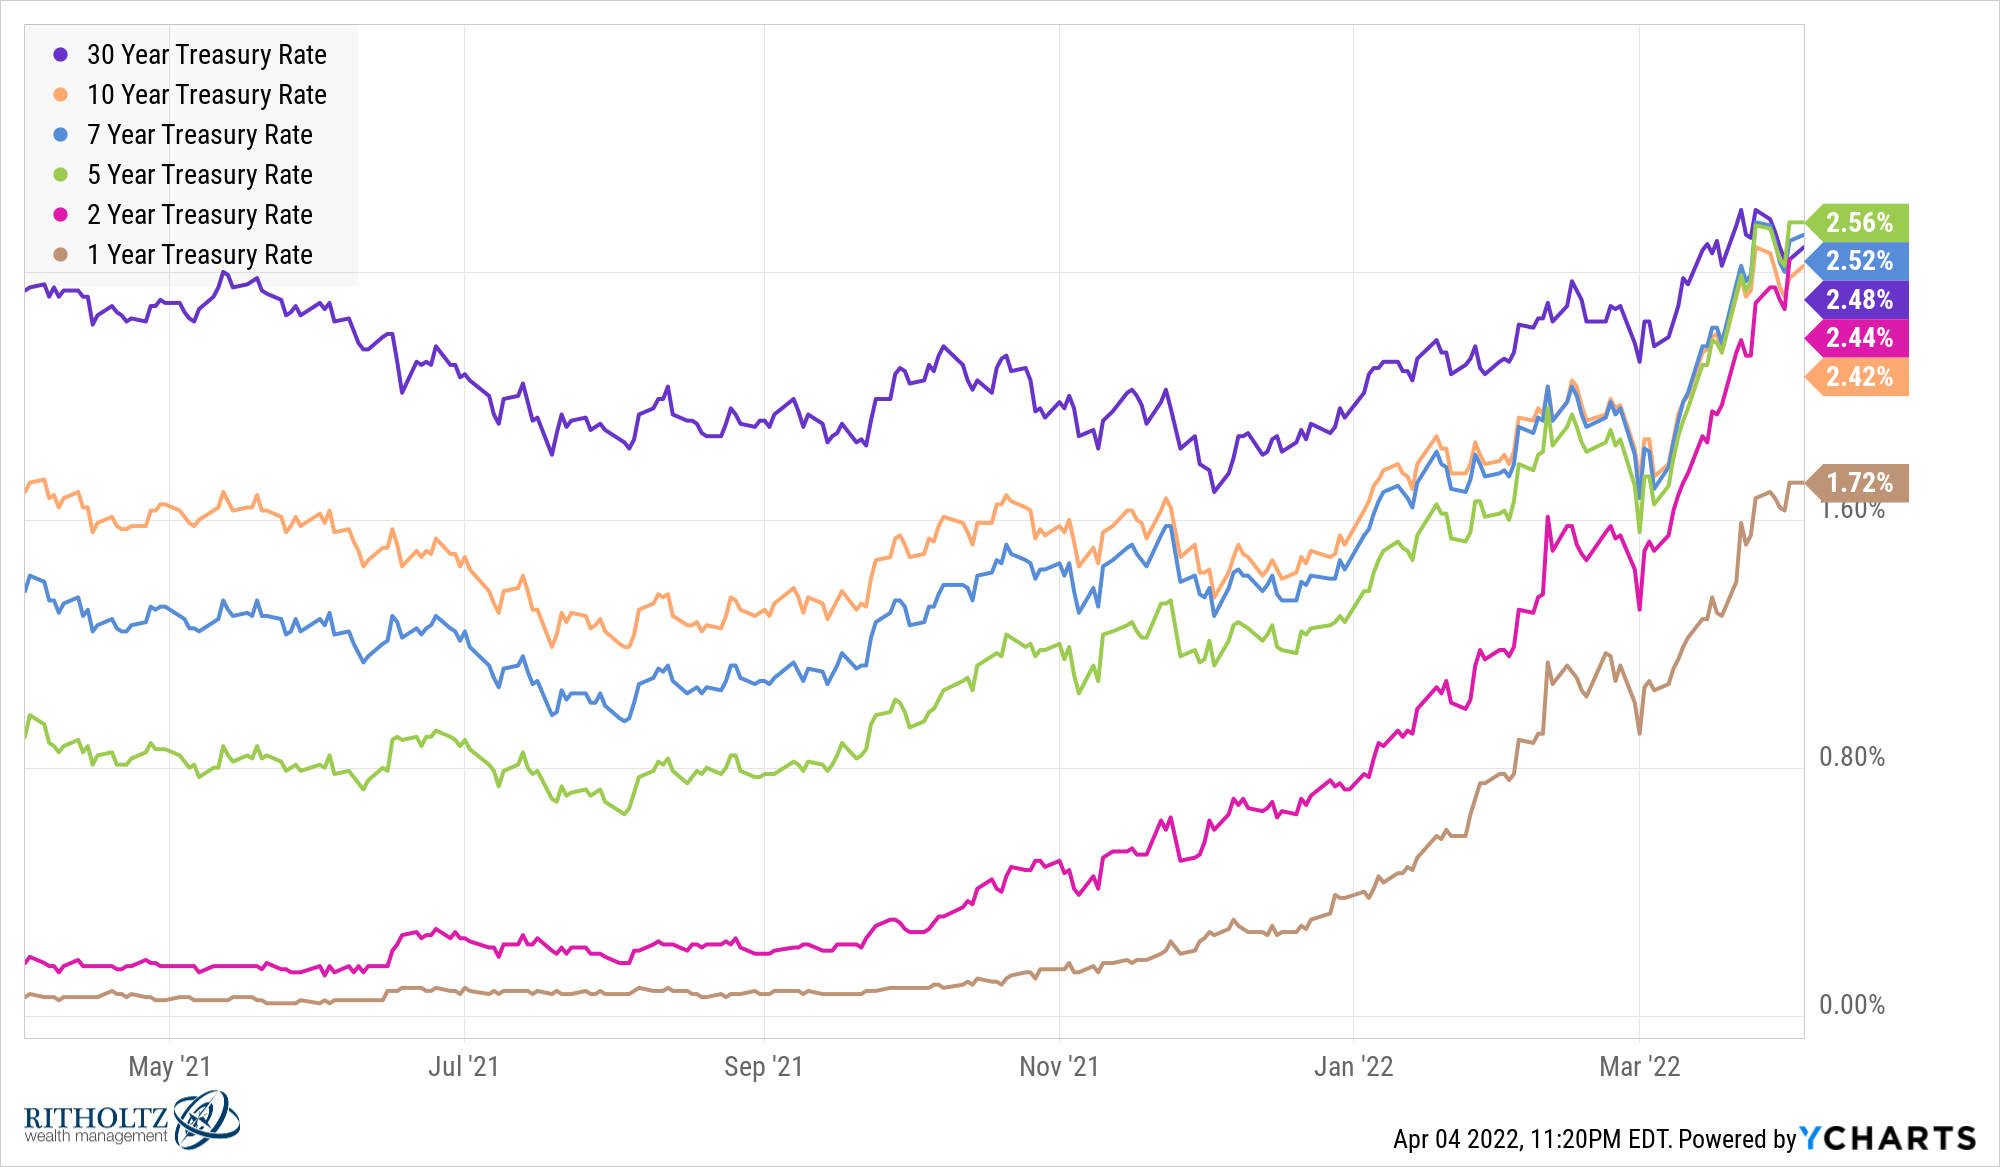
The 5 year and 7 year treasury bonds currently yield more than the 3o year treasury. The 2 year, 5 year and 7 year yields are higher than the 10 year (just barely).
I first wrote about the potential for an inverted yield curve back in 2016:
Bond yield spreads are typically used to gauge the health of the economy. Wider spreads between long-term and short-term bonds lead to an upward sloping yield curve, which can indicate healthy economic prospects — most likely higher growth and inflation in the future. Narrower spreads lead to a flatter or even negatively sloped yield curve, which can indicate poor economic prospects — most likely lower growth and inflation.
The yield curve didn’t invert that year but short-term rates continued to climb as the Fed raised rates through the end of 2018.
In February of that year I looked at the relationship between yield curve inversions and recessions as well as stock market crashes:

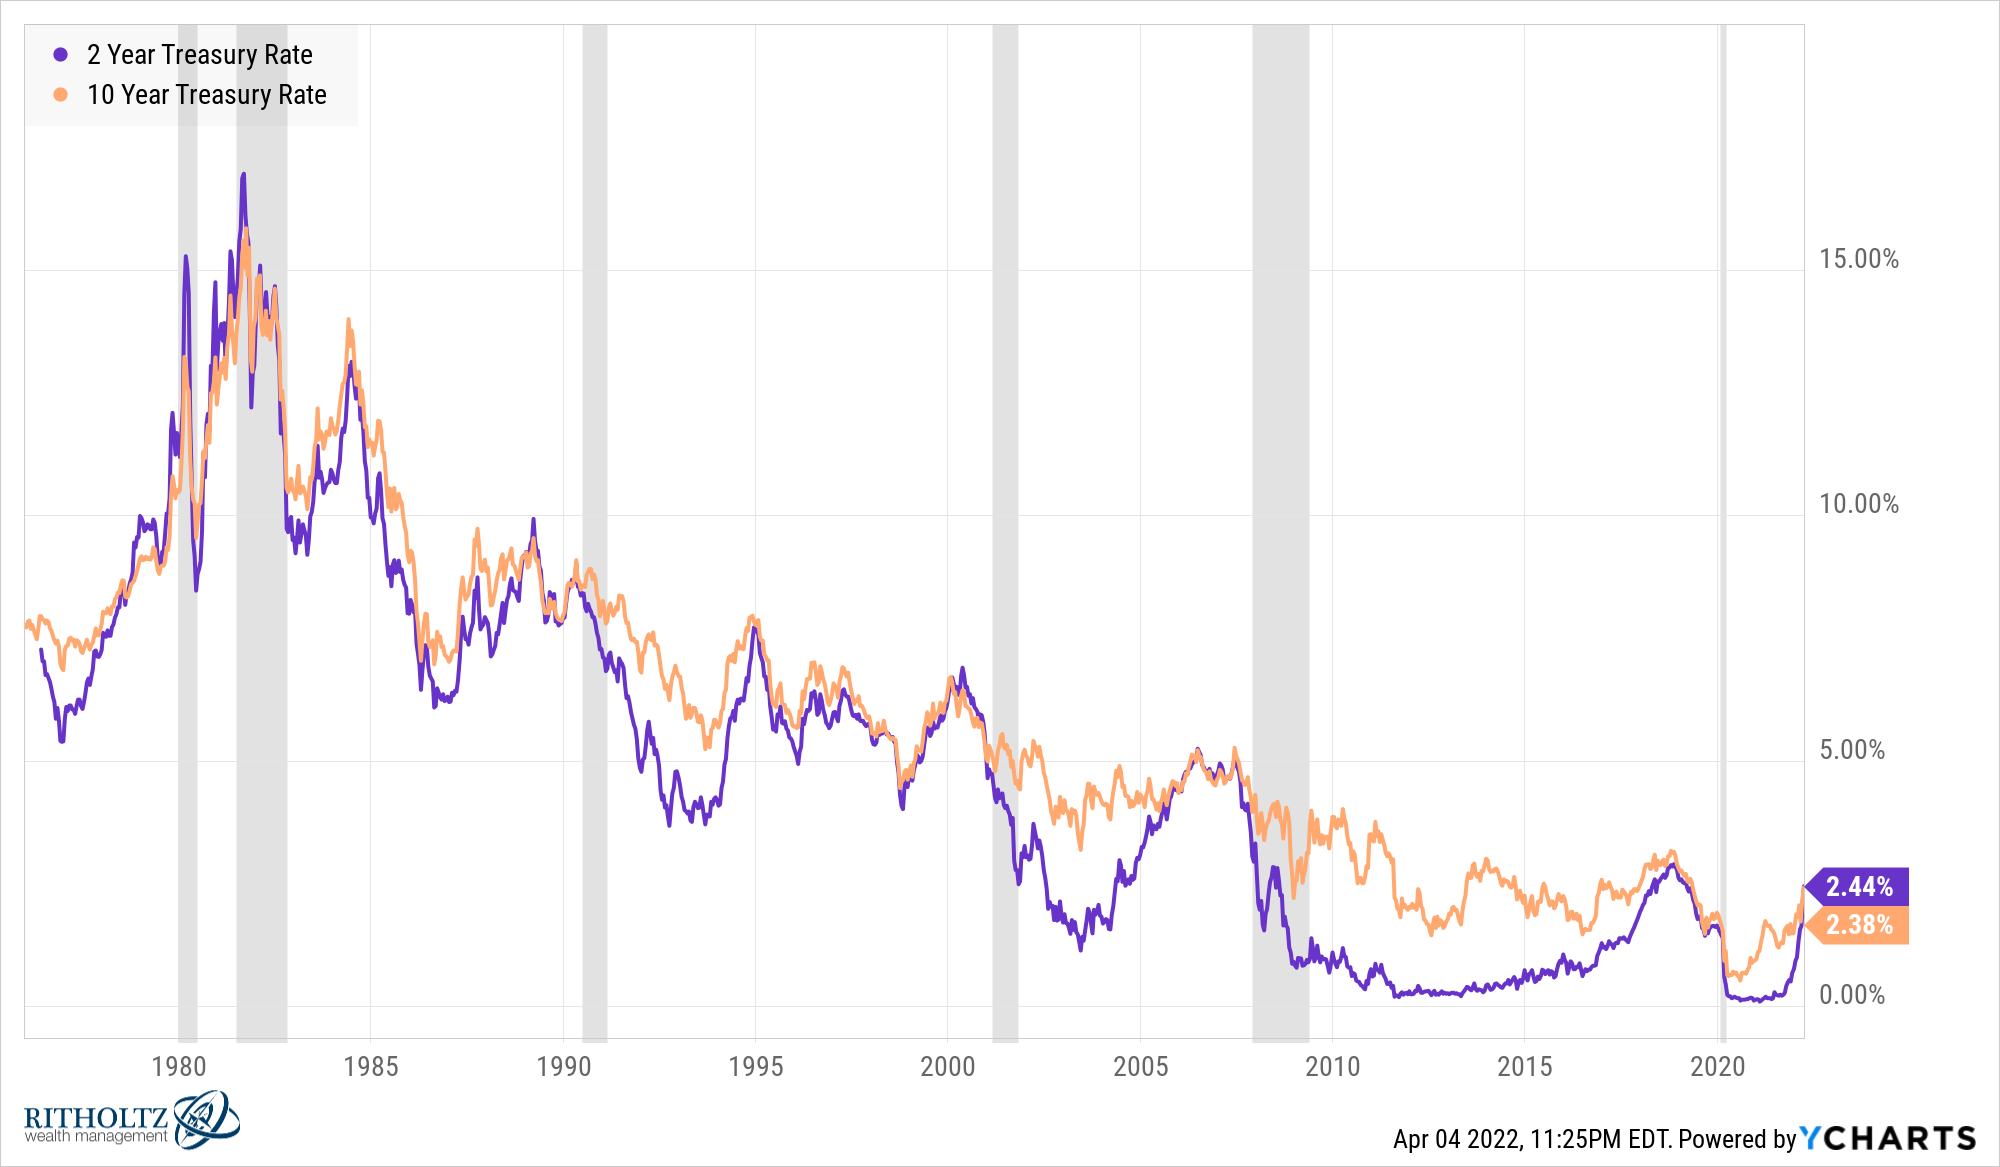
Up until that point, the U.S. economy went into a recession an average of 17 months following an inverted yield curve.
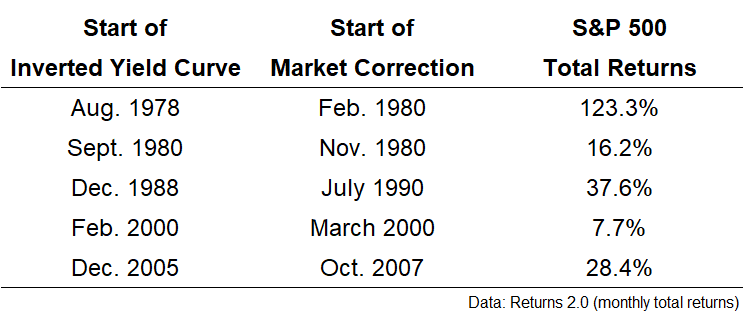
These recessions led to two corrections, one bear market and two nasty crashes in the stock market:

It also makes sense to look at the returns between the yield curve inversion and the start of these stock downturns:

Markets are moving faster these days but this shows the stock market doesn’t always seem to care right away.
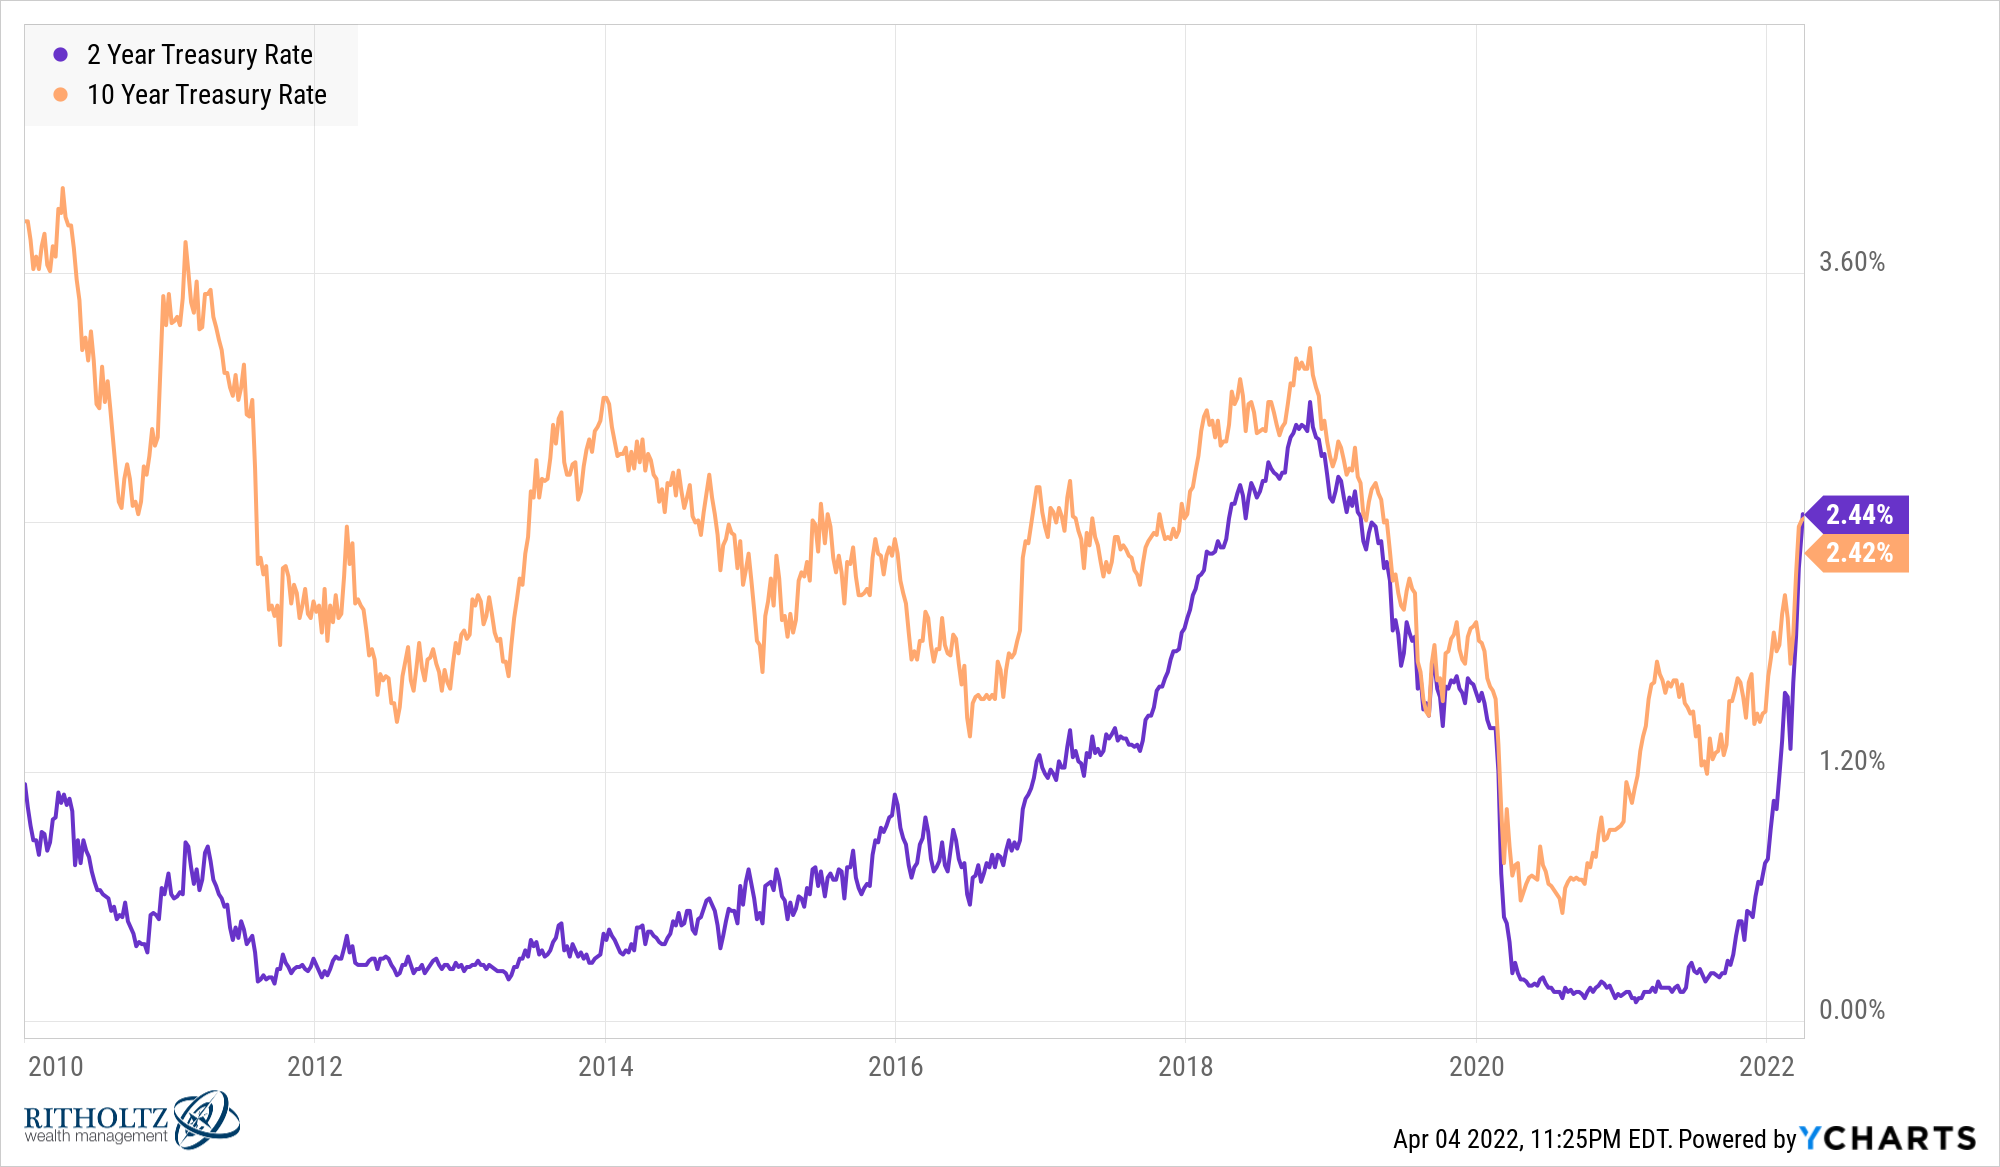
You can see the 10 year and 2 year yields were on a collision course right up until the inversion finally happened in late-2019:

The pandemic quickly put an end to that as the Fed feverishly lowered short-term rates to stave off an economic collapse.
Now that they’re raising rates again short-term yields have played catch-up in a hurry.
Does this mean the economy is destined to go into a recession?
I don’t know.
On the one hand, there is a reason market people get so nervous about inverted yield curves.

The signal has a solid track record.
On the other hand, things that have never happened before happen all the time in the markets.
Maybe this time really is different.
Maybe the Fed can orchestrate a soft landing.
Maybe inflation will slow on its own now that people aren’t getting checks from the government to boost their spending.
Maybe the Fed’s control over the yield curve through bond purchases has changed the usefulness of this signal.
I often feel like Tobias Funke when making arguments like this but nothing would surprise me in the markets at this point.

Now, let’s say you have 100% faith in the yield curve as a macroeconomic indicator. Even if it does have predictive power when it comes to an economic downturn, that doesn’t necessarily help you when it comes to timing the market.
Way back at the end of August 2019, just a few months before everyone’s world was turned upside down (inverted you might say), I wrote that you probably can’t use the yield curve to time the stock market:
Eugene Fama and Ken French recently published a research paper on the topic called Inverted Yield Curve and Expected Stock Returns. Fama and French took their dataset back to 1975, across 11 major stock and bond markets to determine if an inverted yield curve could predict the stock market underperforming short-term treasury bills (a proxy for cash). They compared six different yield spreads, switching from stocks to t-bills when any of these yield curves inverted. Then they looked out over the next one, two, three, and five year periods to see what happened when switching from stocks to cash.
The duo’s conclusion states, “We find no evidence that inverted yield curves predict stocks will underperform Treasury bills for forecast periods of one, two, three, and five years.” They compared three broad market indexes, using the U.S. stock market, the World stock market, and the World ex-U.S. stock market. The switching strategy of going from stocks to cash underperformed a long-only buy and hold strategy in all 24 instances using the U.S. and World markets. The yield curve signal also underperformed in 19 of 24 World ex-U.S. backtests.
Even if the yield curve does predict a recession yet again you can’t predict:
- When the recession will happen.
- If/when the stock market will begin to fall.
- The magnitude of the recession and stock market correction.
- What the Fed will do in the meantime.
Economic regime shifts often lead to increased market volatility. But that doesn’t make it any easier to make money in the stock market.
Further Reading:
You Probably Can’t Use the Yield Curve to Time the Stock Market
1I’m working on more than 9 years of this blog now.
