A reader asks:
Is there any way to prep for stagflation? Any actionable ideas?
Stagflation is an economic environment characterized by high inflation, high unemployment and slow or negative economic growth. In other words, not fun.
This is a risk that seems to be gaining steam amongst people who like to worry about things for a living.
Larry Summers (the guy from The Social Network) is one of those people who is constantly worried about things. Here’s his recent take:
The Fed’s current policy trajectory is likely to lead to stagflation, with average unemployment and inflation both averaging over 5 percent over the next few years — and ultimately to a major recession.
There are a lot of people who think the Fed is trapped right now. They might be right.
It’s possible the Fed’s only option is to slow demand by raising interest rates and signaling they will do so at the expense of economic growth. It’s also true inflation might not care about higher interest rates if supply chains remain constrained and we end up with a lingering commodities crisis.
There isn’t much precedent for stagflation in the U.S.
The 1970s is basically the only period that comes to mind.
Let’s review what transpired in the disco decade.
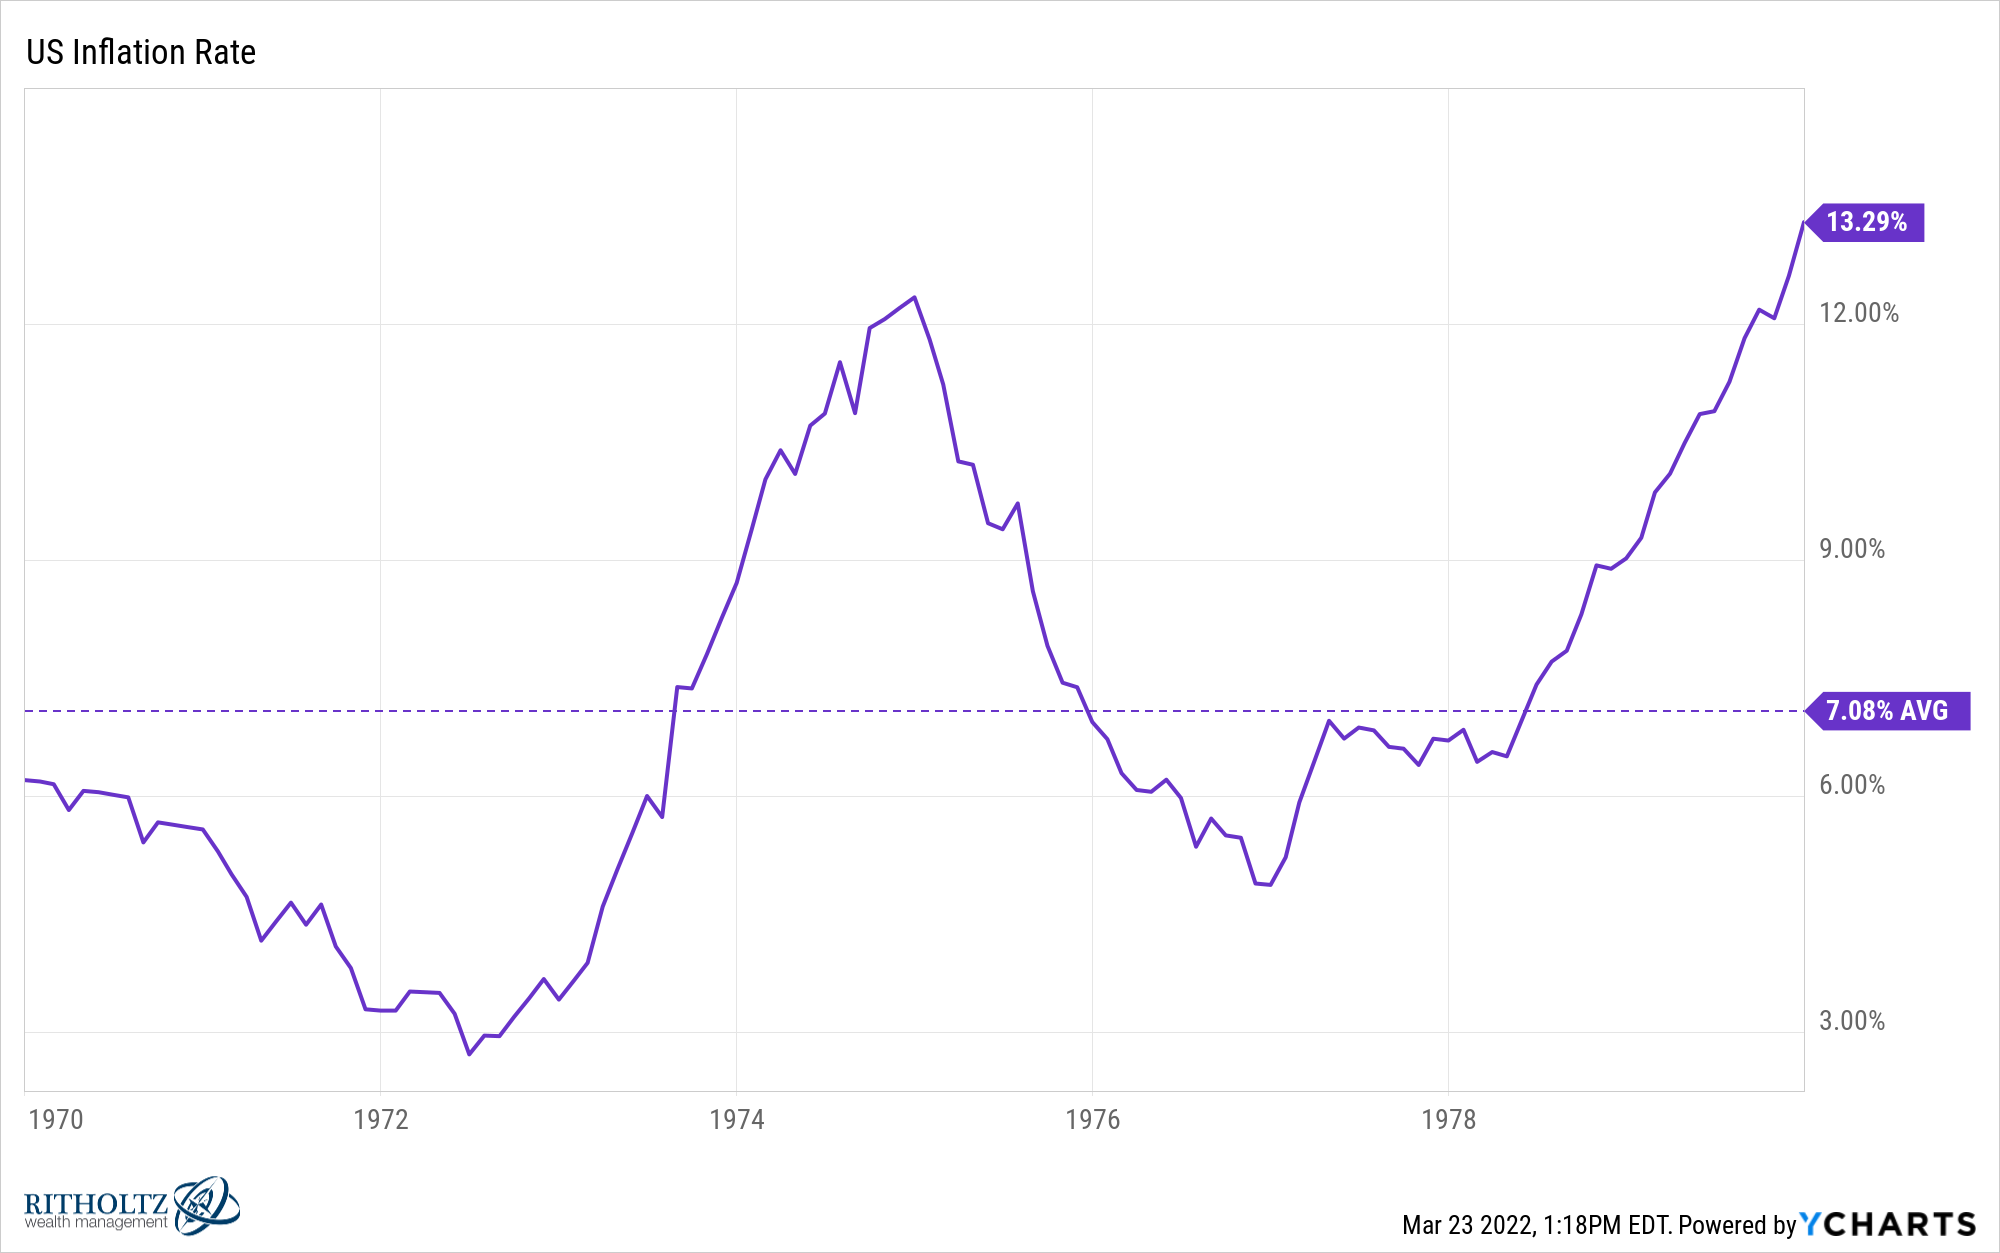
The inflation rate was stubbornly high for most of the decade, averaging more than 7% and growing to more than 13% by the end of the 70s:
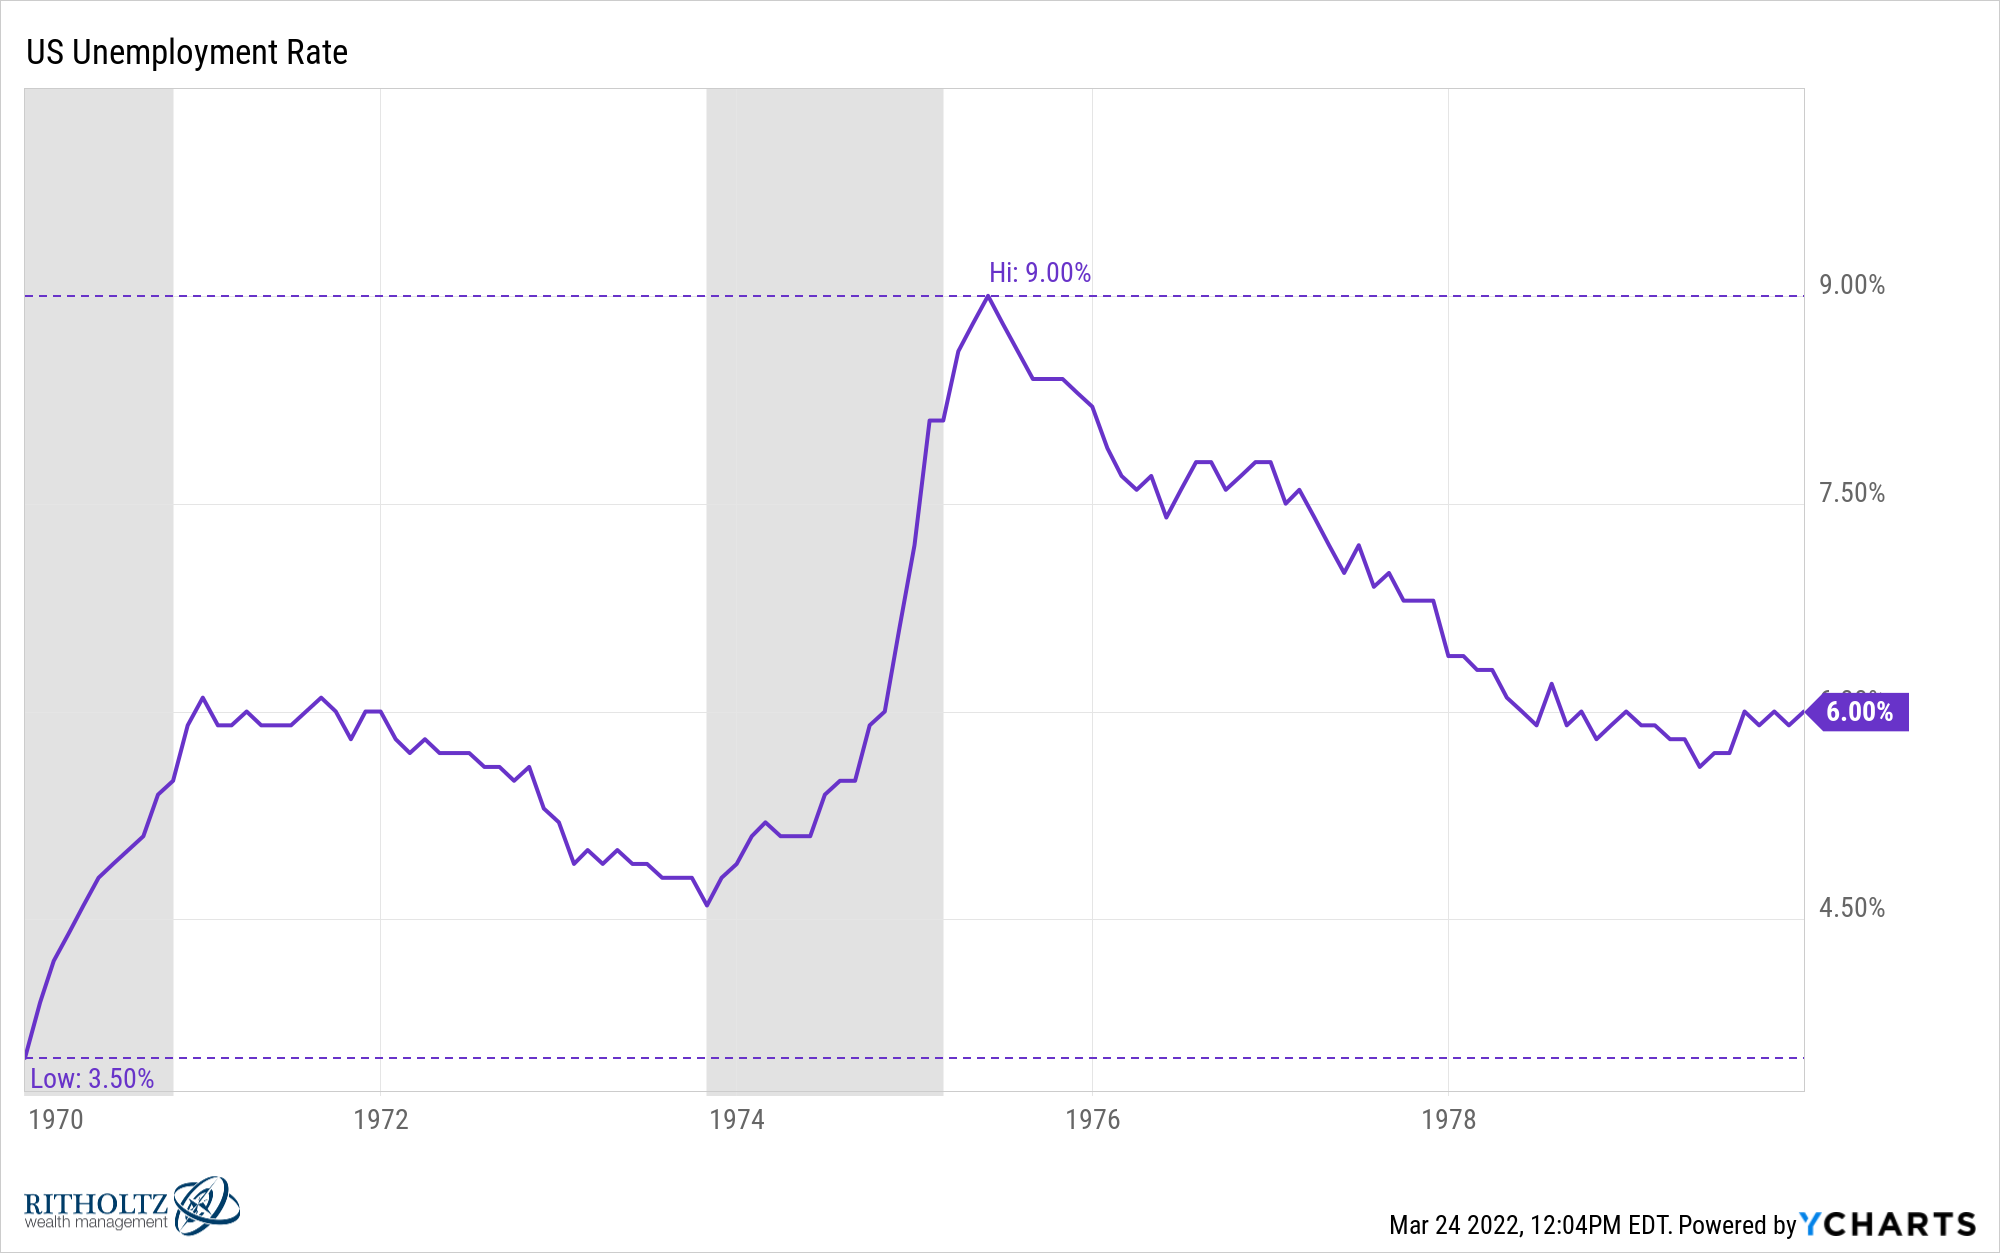
The unemployment rate was also relatively high, reaching 9% following the 1973-1974 recession and ending the decade at 6%:
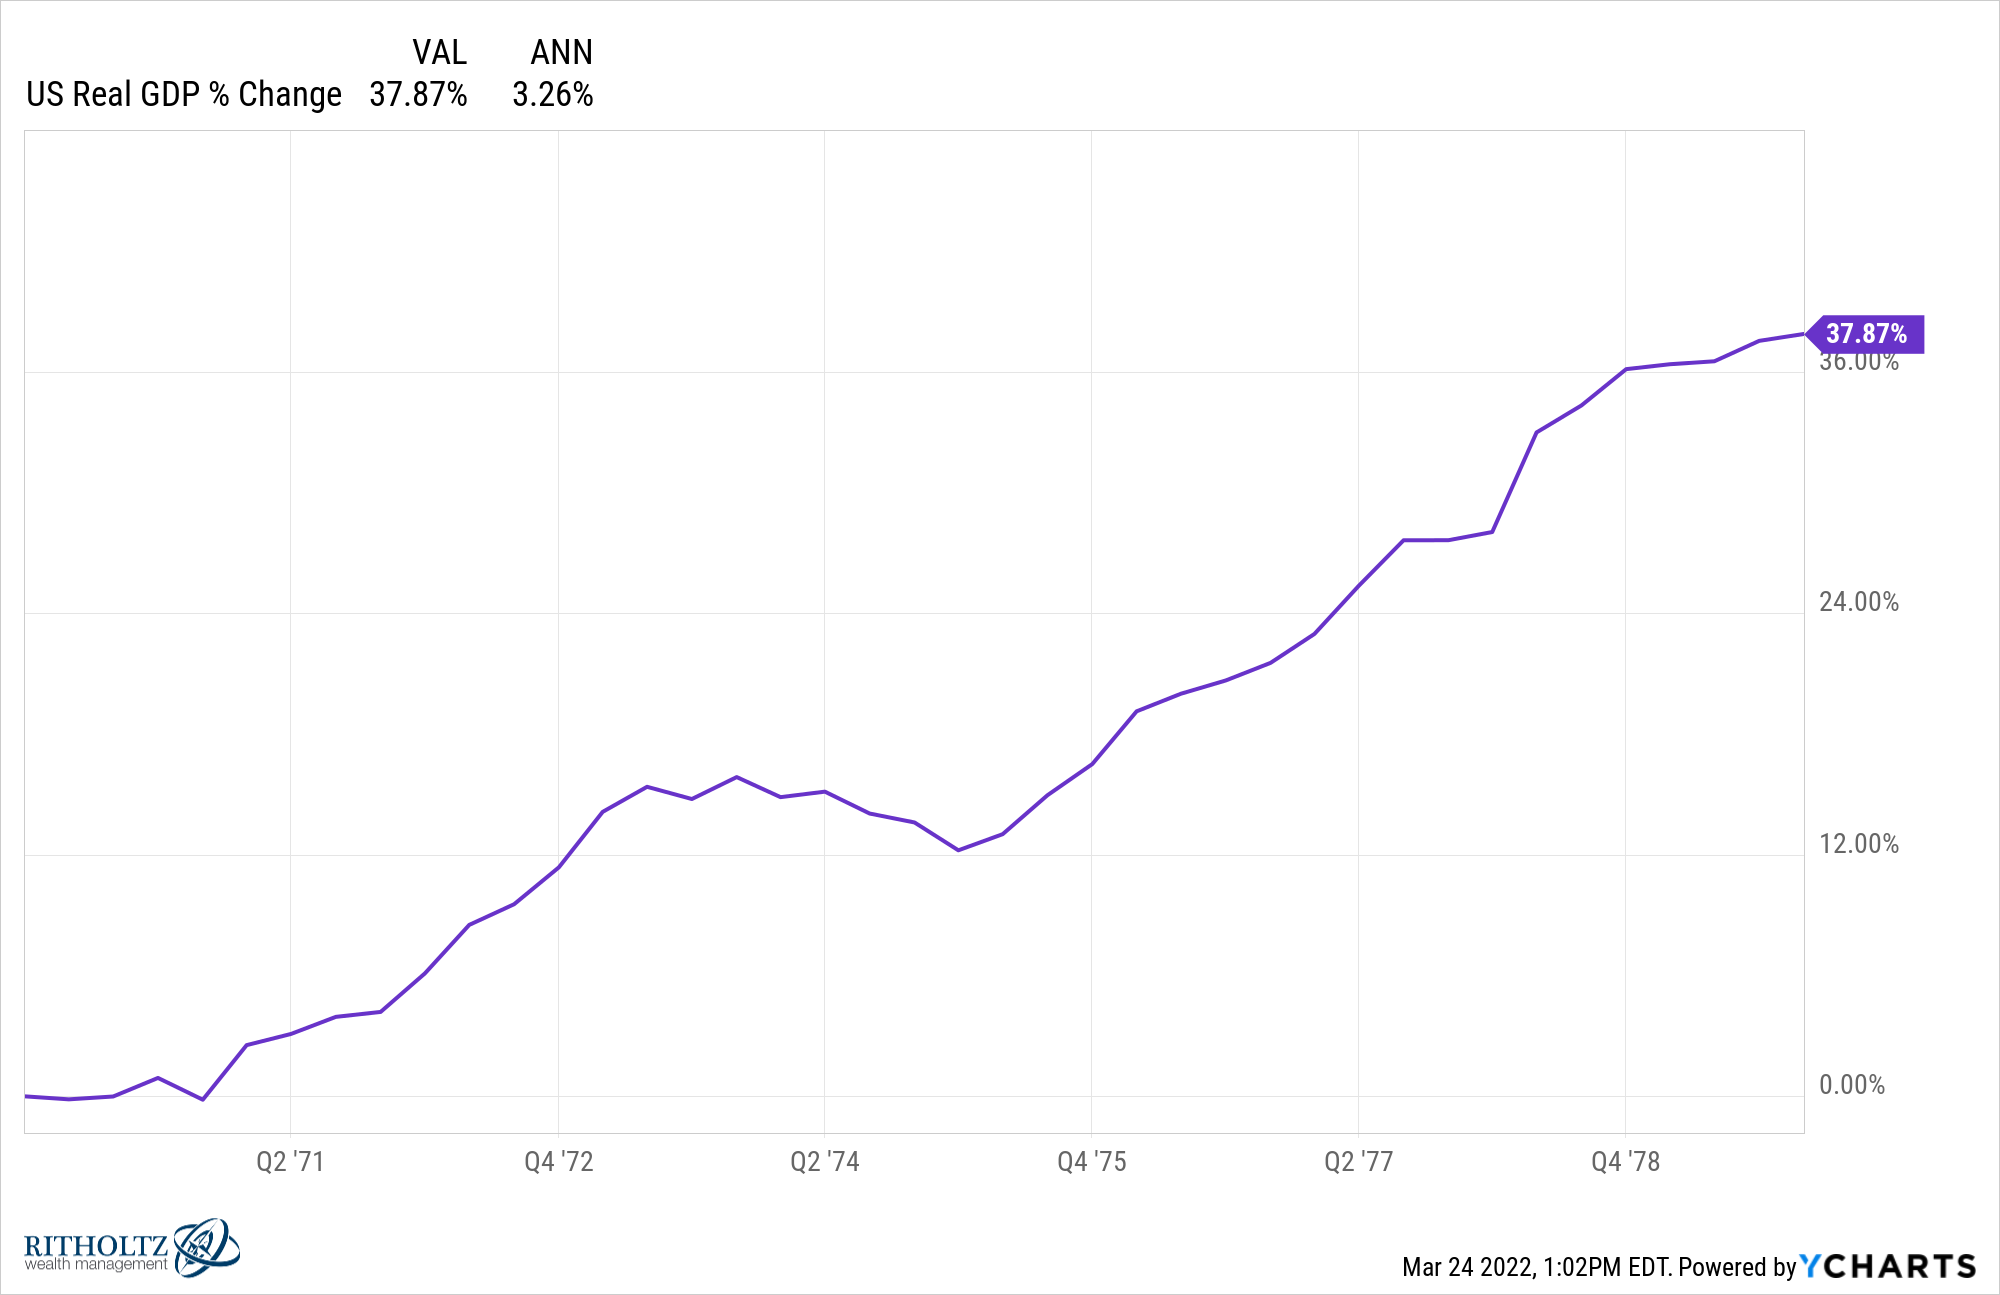
Real economic growth was probably better than most people assume at more than 3% but I’m not sure that mattered considering how much people hate high inflation:
The biggest difference between then and now is interest rates:
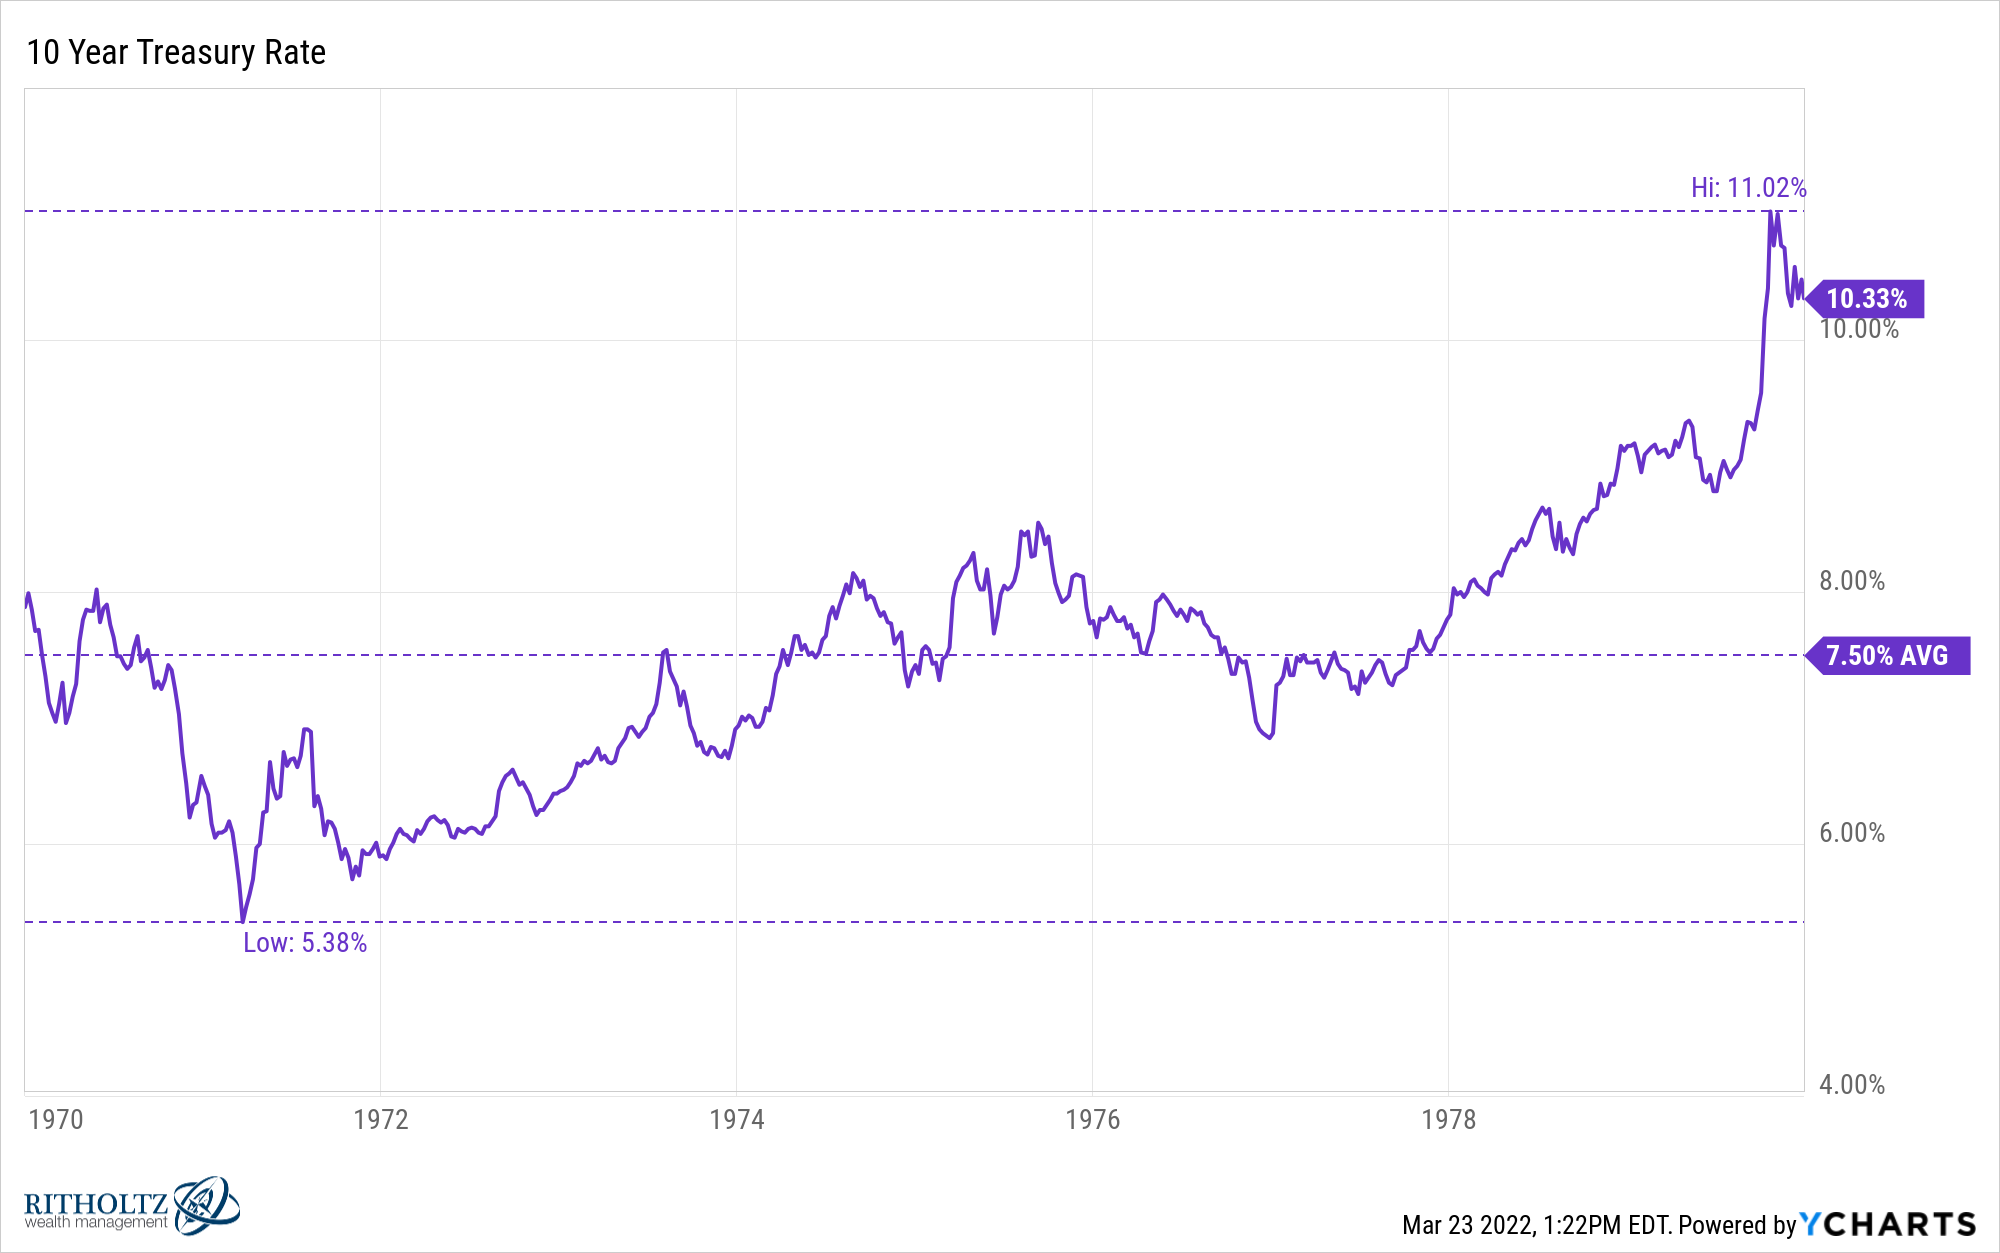
The 10 year treasury yield never went below 5.3% in the 70s. It averaged nearly 8% in that 10 year period and reached double-digit levels heading into the 1980s. The current 2.3% rate is nowhere close to those levels.
The range in the Fed Funds Rate in the 1970s shows how bizarre that decade was from an economic perspective:
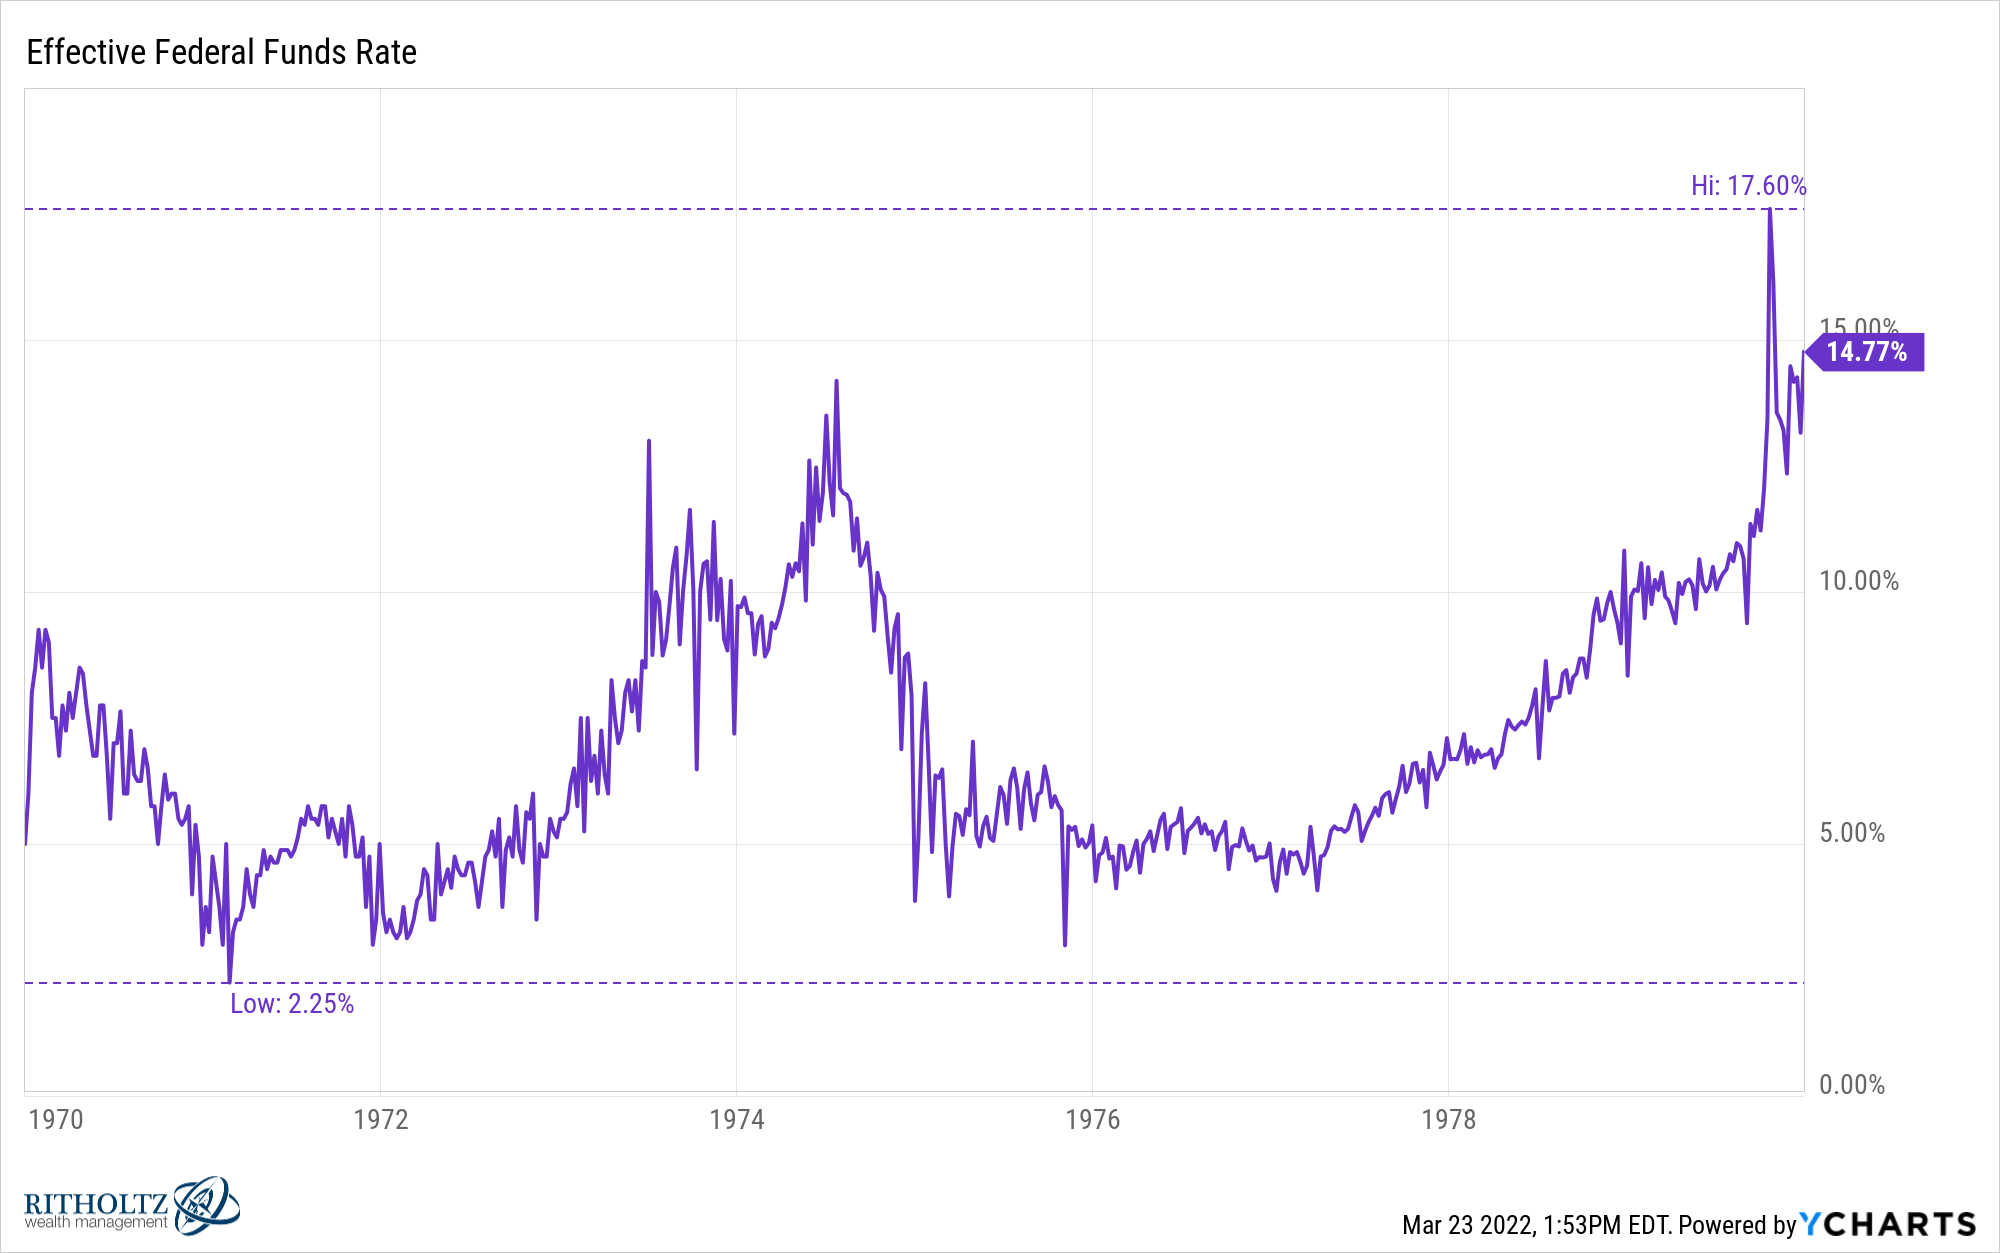
Inflation was already rising in the 1960s but a recession from 1969 to 1970 saw the Fed bring short-term rates to almost 2%. That probably didn’t help with inflation. By the time they ratcheted rates up to nearly 18% in 1979 it was already out of control.
The simple answer for what worked in the markets in the 1970s is commodities.
The GSCI Index was up more than 20% per year on the decade. Oil jumped more than 800%. Energy stocks were up more than 70% on an inflation-adjusted basis. Gold was up almost 1,000% in total.1
The U.S. stock market as a whole did better than you would think on a nominal basis. The 70s are actually one of the best decades ever in terms of earnings growth:
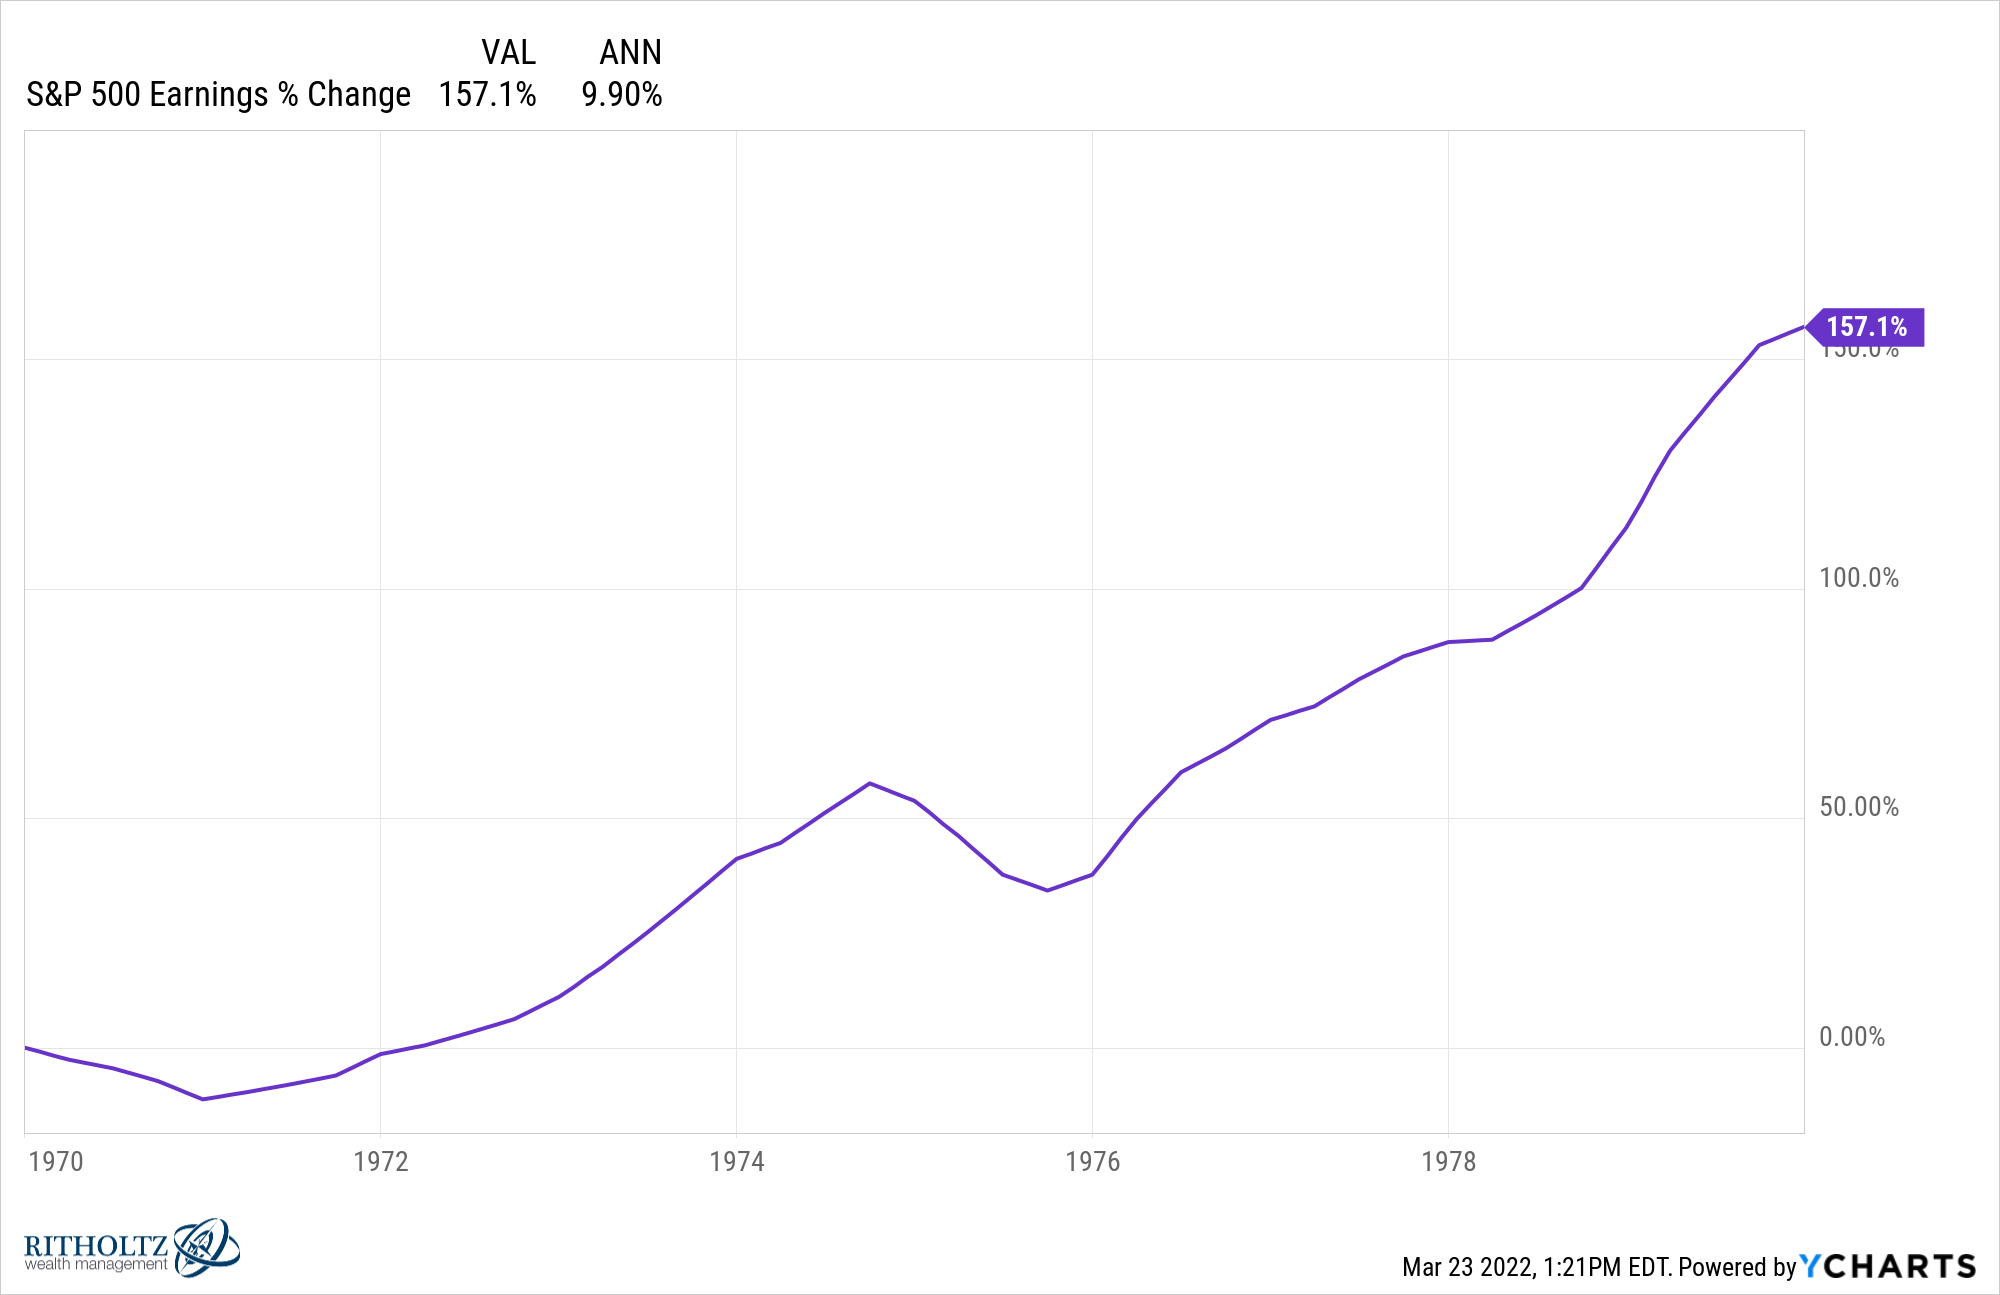
This makes sense when you consider corporations tend to raise prices in an inflationary environment.
The S&P 500 was up 78% in total or roughly 6% per year. That’s not bad until you consider inflation was up 7% per year, meaning real returns were negative.
The most surprising return from an asset class perspective might be how well cash did.
In fact, if we compare stocks, bonds and cash going back to the 1930s, the 1970s was the only decade where cash beat both stocks and bonds at the same time:
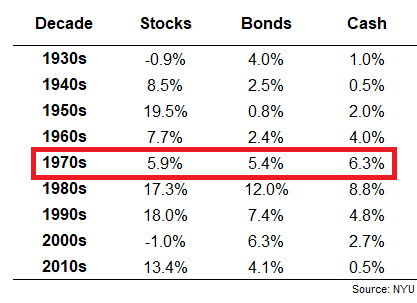
This gets back to the rates story again, with yields being much higher back then. You can see those higher rates carried bonds and cash through the 1980s, 1990s and 2000s as well.
Value stocks had their highest outperformance over growth stocks in the 1940s and 1970s:
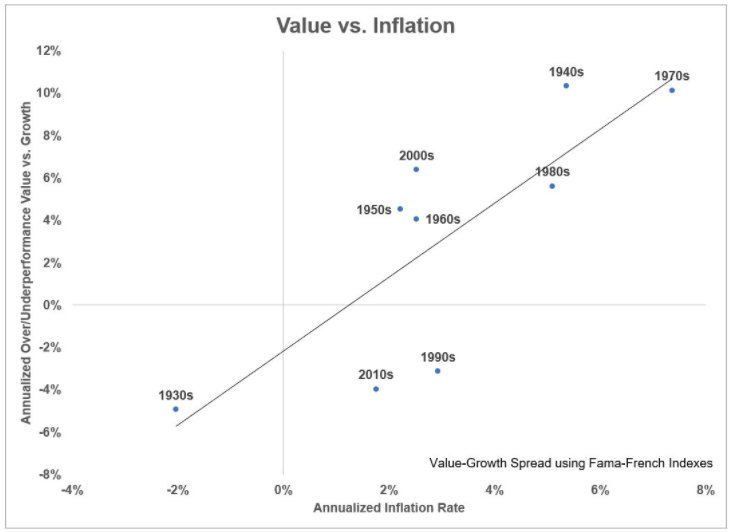
The 1940s and 1970s also happen to have the highest inflation rates of any decades going back to the 1930s.
Value stocks are already outperforming growth by a healthy clip so far in 2022. I don’t know if this relationship will hold but it makes sense from a theoretical perspective that value would outperform growth when inflation is higher.
Changing economic environments are a good use case for my favorite risk management technique — diversification.
There is one other asset that had its best nominal performance in the 1970s — housing. These are the annual returns for housing in the United States by decade from Robert Shiller:
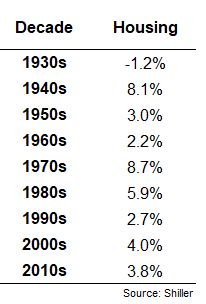
If you own a home there’s a good chance it’s your best performing financial asset this year (especially when adjusted for the impact of inflation on your mortgage payment).
As with all economic outcomes, I don’t know if stagflation is going to happen. I cannot predict the future.
But the risk of stagflation does seem to be elevated relative to where we were before the pandemic.
We talked about this question on this week’s Portfolio Rescue:
I also had Taylor Hollis help me answer some questions about setting up trusts and donor-advised funds.
1Although you could make the case a big part of the rise in gold prices in the 1970s was due to Nixon suspending the convertibility of gold with U.S. dollars and allowing the price to float more freely.
