At the worst point of the sell-off this year, the S&P 500 was down a little more than 13%:
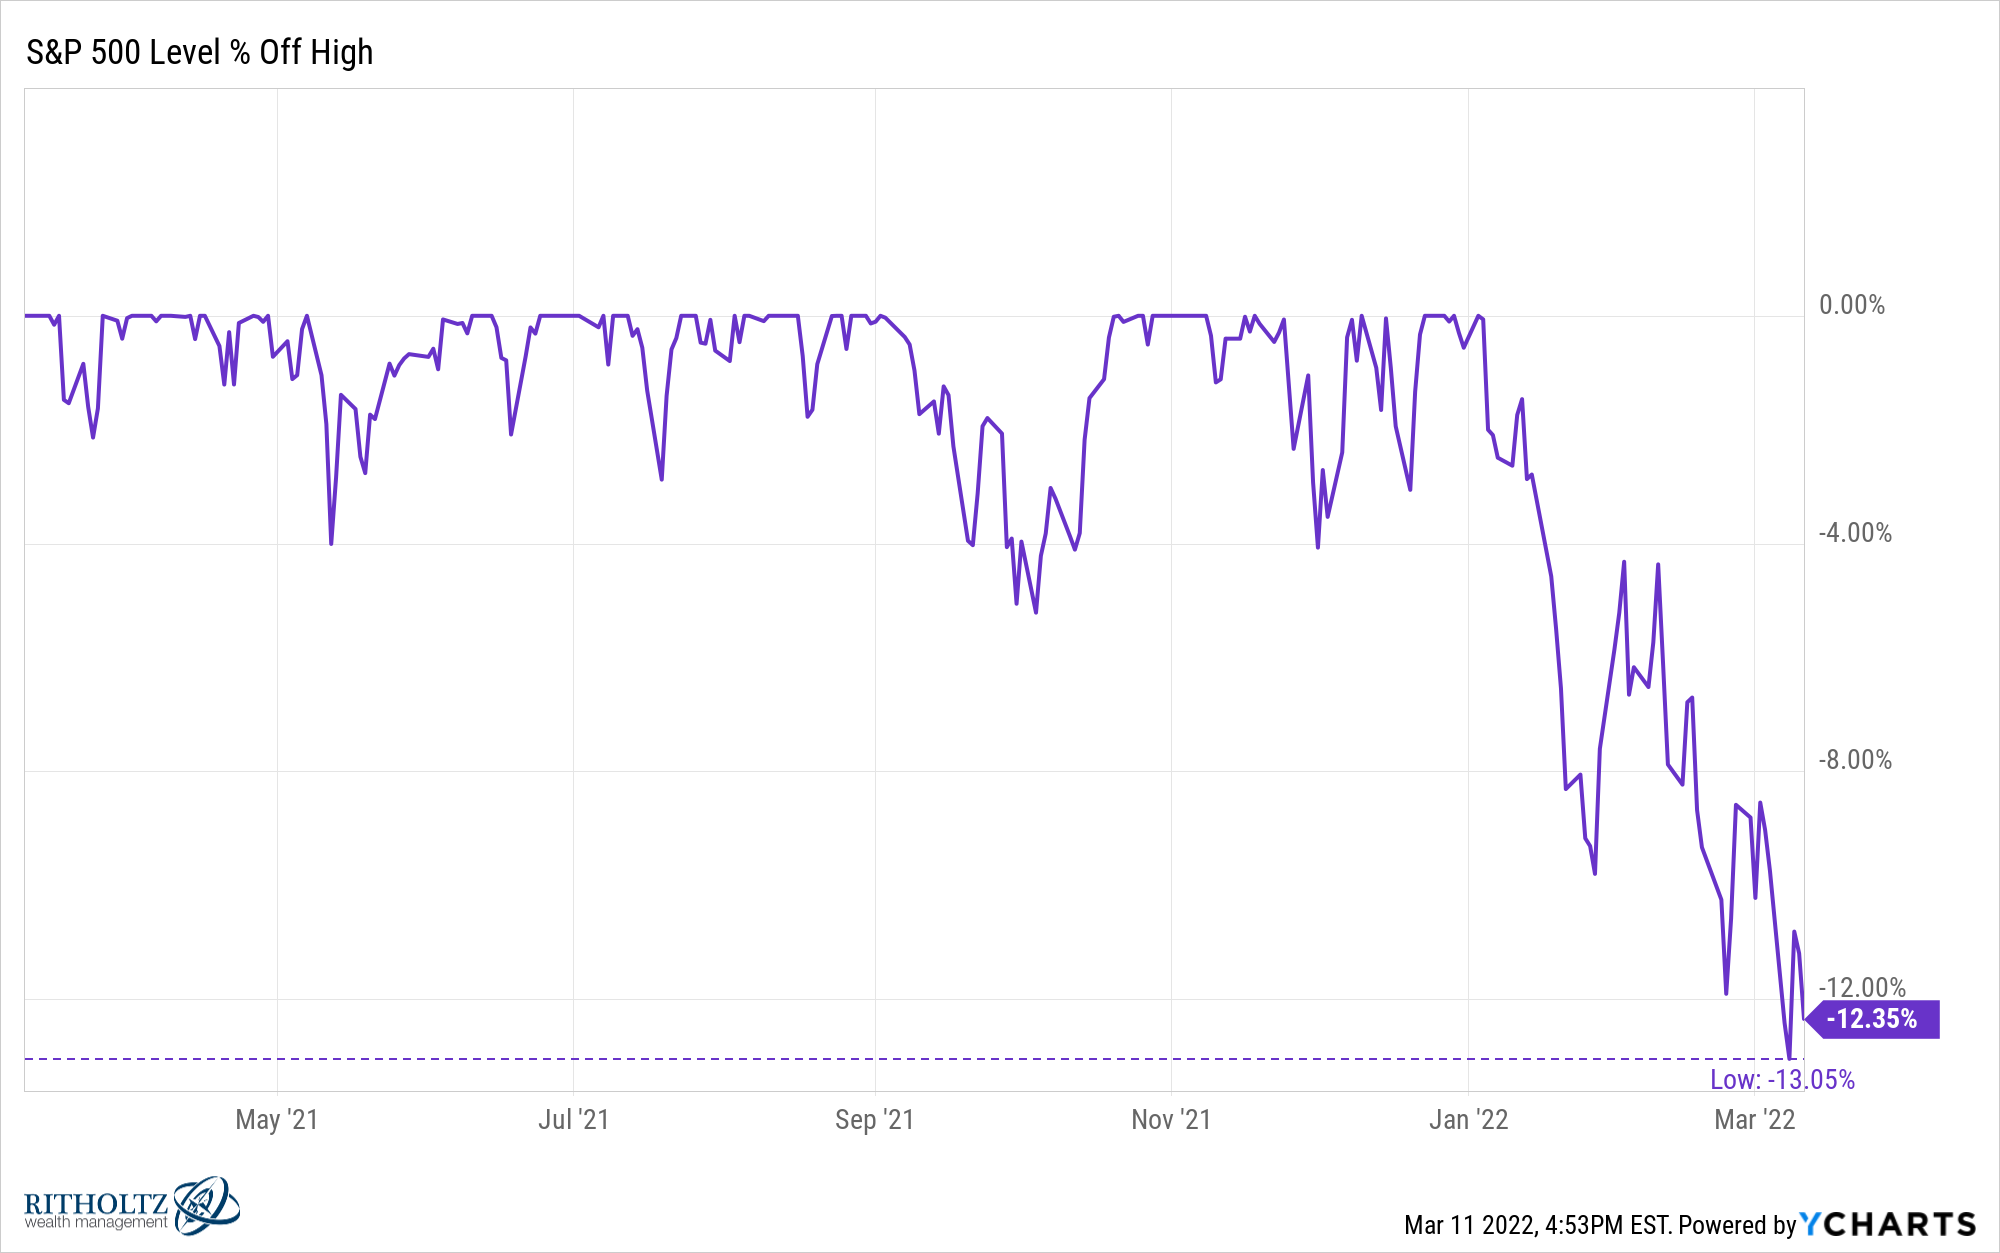
Going back to 1950, the average peak-to-trough drawdown in a given year is -13.6%:
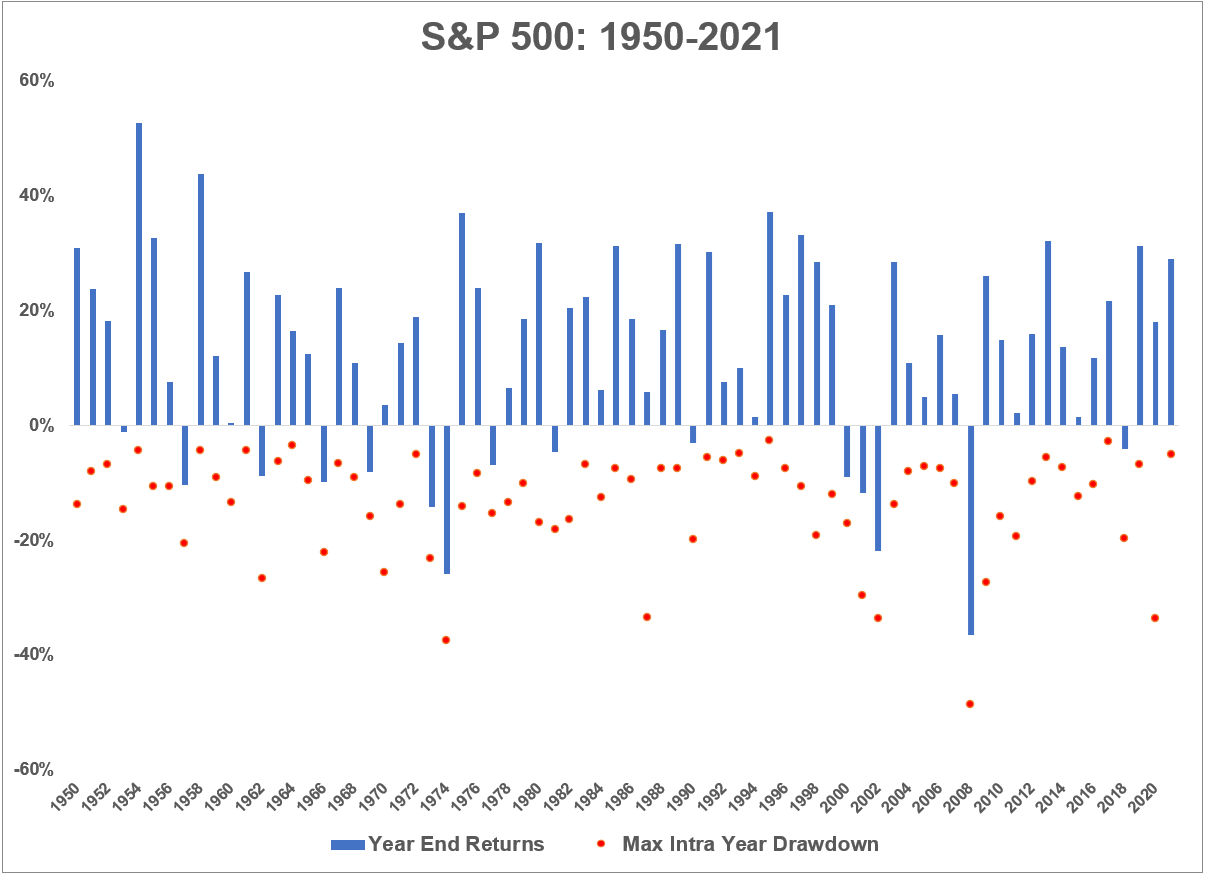
So we’re right around average. No year is ever average when it comes to the stock market and this year is obviously far from over but I like to put these things into perspective when things seem scary.
It’s always something.
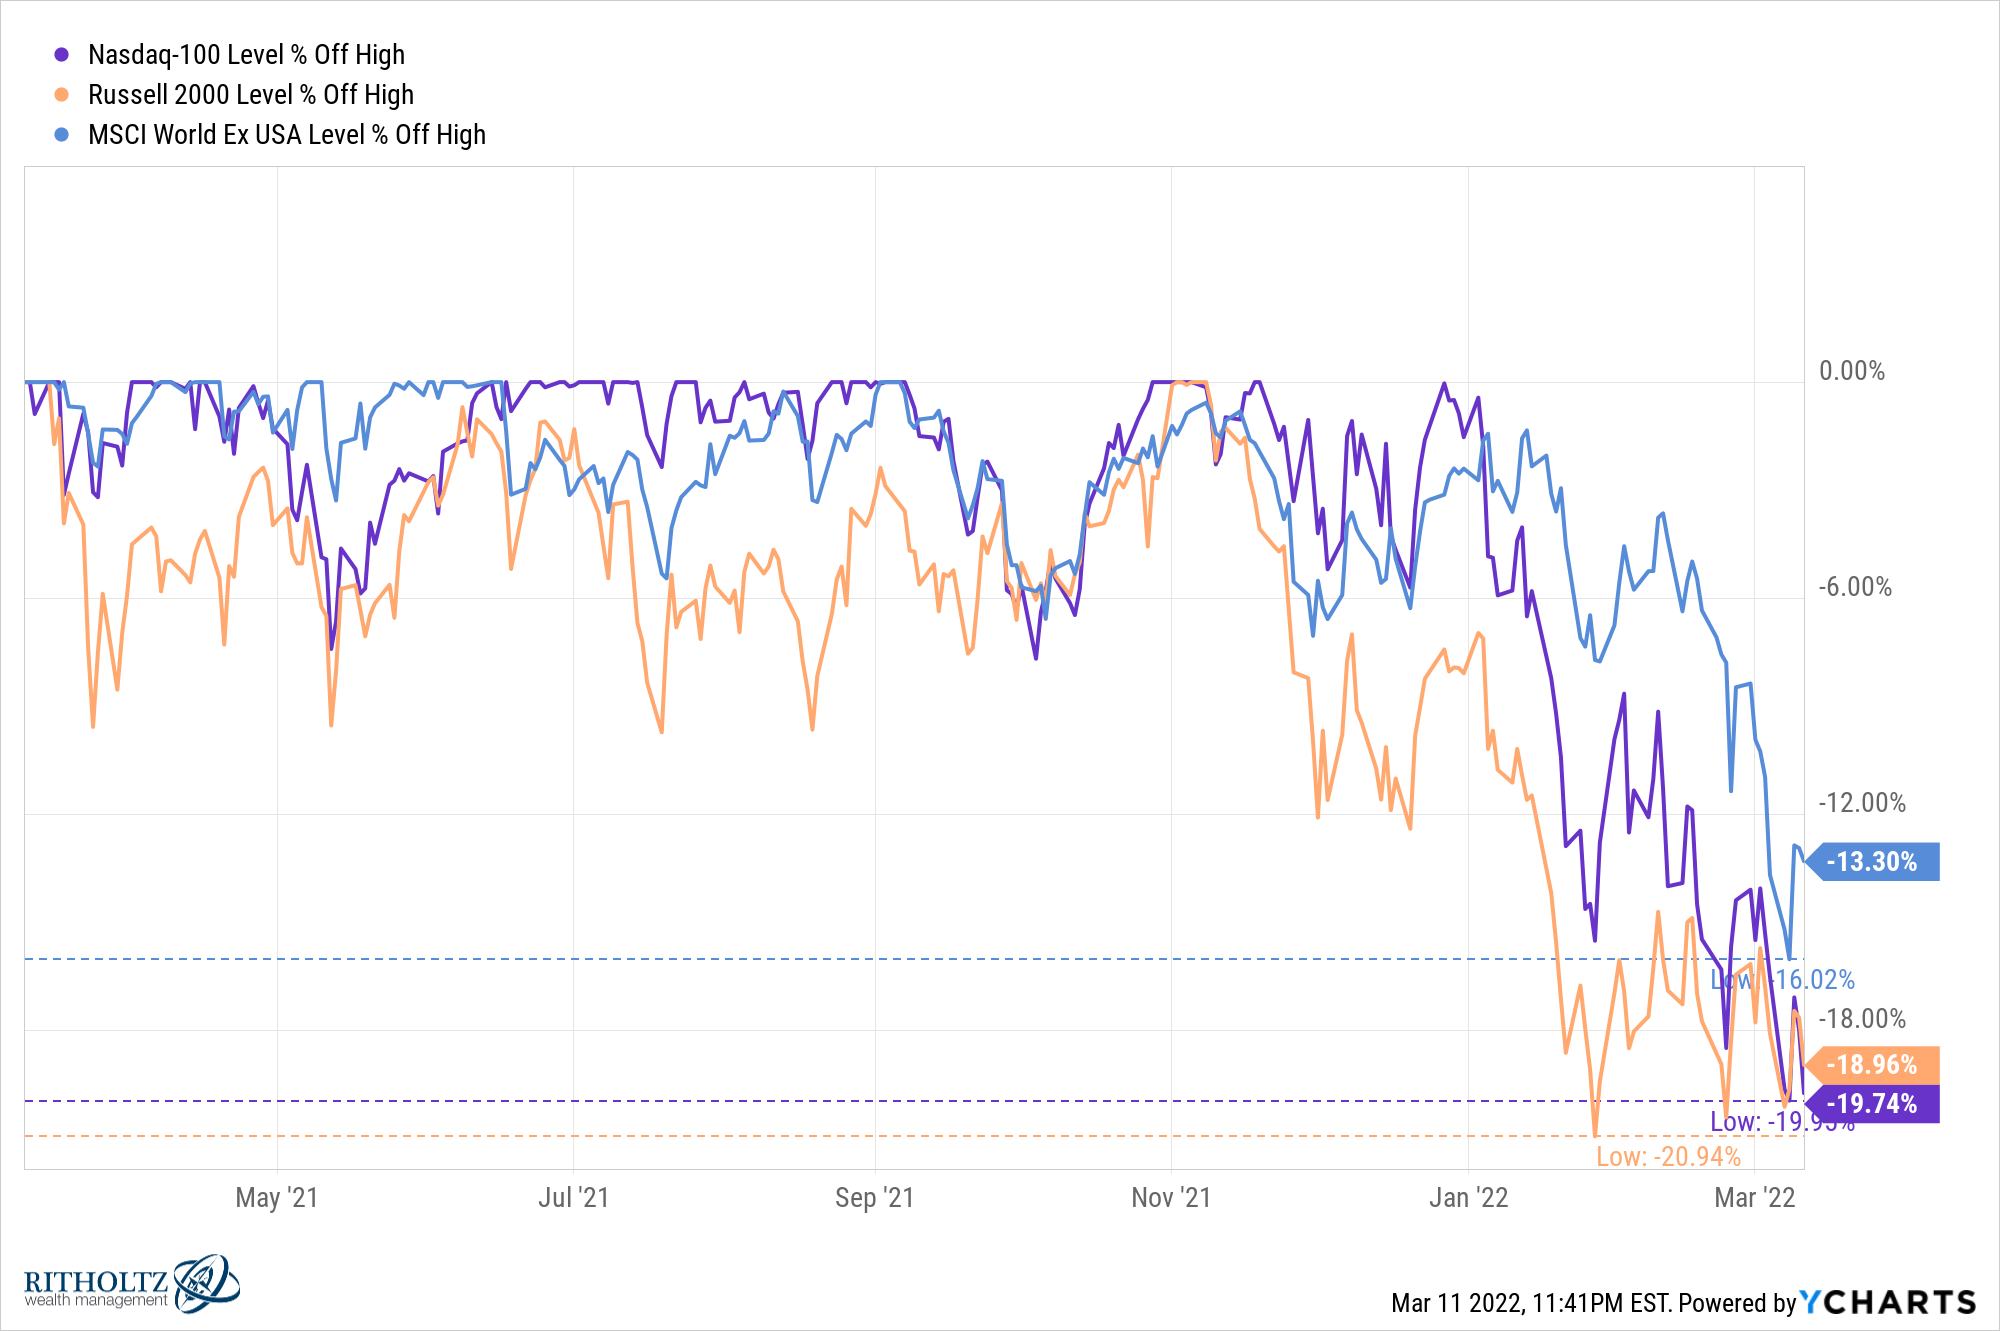
There is also more to the stock market than the S&P 500. At their lows in recent weeks, the Nasdaq 100, Russell 2000 and MSCI All World ex-USA were down 20%, 21% and 16%, respectively:
And if you look under the hood, things are even worse than they seem if you’re a stockpicker.
While the Russell 3000 Index (a proxy for the entire U.S. stock market) is down 11% or so from all-time highs, more than 60% of the companies that comprise the index are down at least 20% or more from 52-week highs. Nearly 30% of stocks are down 40% or more from 52-week highs.
This year alone nearly one-third of U.S. stocks are down at least 20%.
I don’t know if this will turn into the technical definition of a bear market where the index is down 20% or worse. It’s always possible but I cannot predict the short-term movements of the stock market, especially during a downturn.
Regardless of some made up definition, this feels like a bear market already for many investors.
Here are some thoughts on bear markets:
Staring at prices all day won’t make them stop going down. It won’t make them go up either. Paying more attention to the markets doesn’t give you more control over them.
My rule of thumb during a downturn is I never look at my portfolio. I can guess how much it’s down based on my holdings and asset allocation but looking at the values doesn’t do me any good.
Bear markets are confusing. On Monday, the S&P 500 fell 3%. The Nasdaq 100 was down almost 4%.
Then on Wednesday the S&P 500 shot up nearly 3% while the Nasdaq 100 gained close to 4%.
This isn’t anything like March 2020 when we saw a string of -8%, +5%, -5%, -10%, +9%, -12%, +6% and -5% in consecutive days but this is what happens during downtrends.
Investors panic in both directions when things get crazy because losing money freaks people out.
You can see the biggest losses and the biggest gains occur during a rush to the exits when volatility spikes:
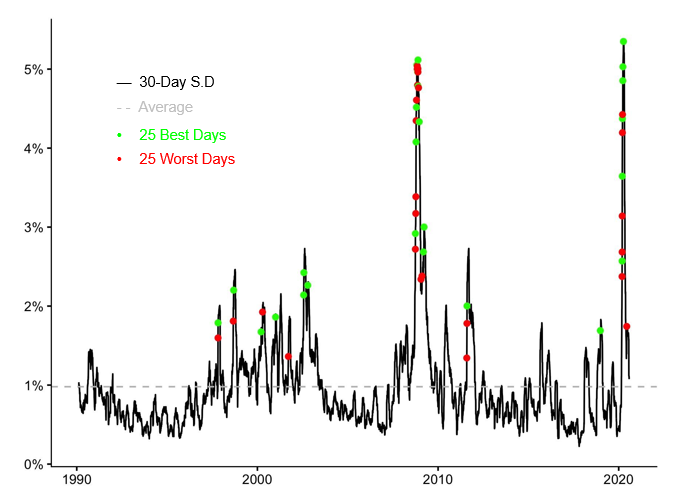
Volatility clusters when markets fall which keeps people on their toes.
The people using this as an opportunity to scare you will never get you back in. There is a difference between the people who get excited about bear markets because it’s a good opportunity to buy at lower prices and the people who get excited about bear markets because they want to watch the world burn.
The perma-bears will happily tell you why things are getting worse on a daily basis. They will use scare tactics and put out arguments that sound intelligent.
But they will never get you back into the markets after trying to scare you out of them.
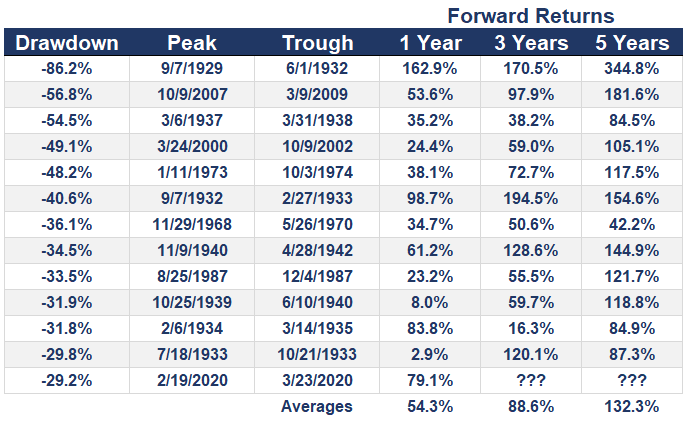
Bear markets are buying opportunities. I’ve looked at the returns from the bottom of bear markets before:
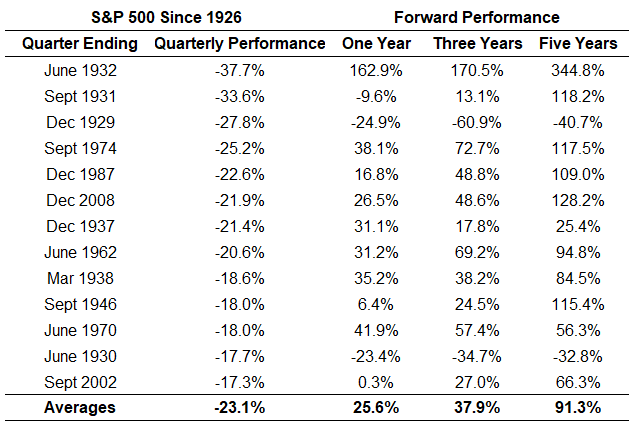
I’ve looked at what happens after stocks have a really bad quarter:
And I’ve looked at what happens after stocks have a really bad month:
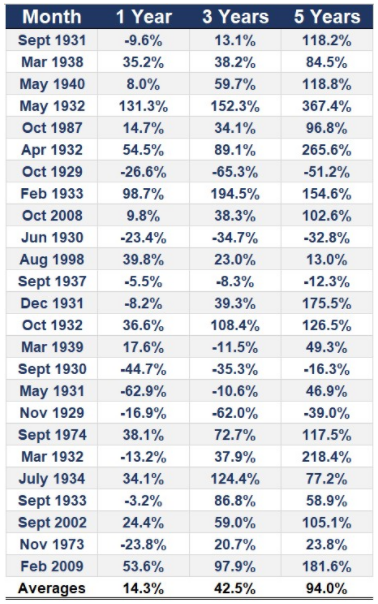
When stocks are down big they tend to have pretty solid returns going forward.
Of course, the current losses are nowhere near these historical examples. And the future doesn’t have to look like the past.
But buying when stocks are on sale tends to be a good strategy over the long run.
History provides context, not a crystal ball. I love looking at historical data when it comes to the markets. It helps provide context, shows investors a range of potential outcomes and helps give a sense of what’s possible in the markets.
But you can’t predict the future from the past. There is no use for the words ‘never’ or ‘always’ when it comes to the markets because things that have never happened before happen all the time. And things that seemingly work all the time eventually stop working.
It’s been a while since we’ve had an extended correction. Markets are moving faster than ever these days. If you look at every correction since the Great Financial Crisis, the recoveries have all been V-shaped in relatively short order:
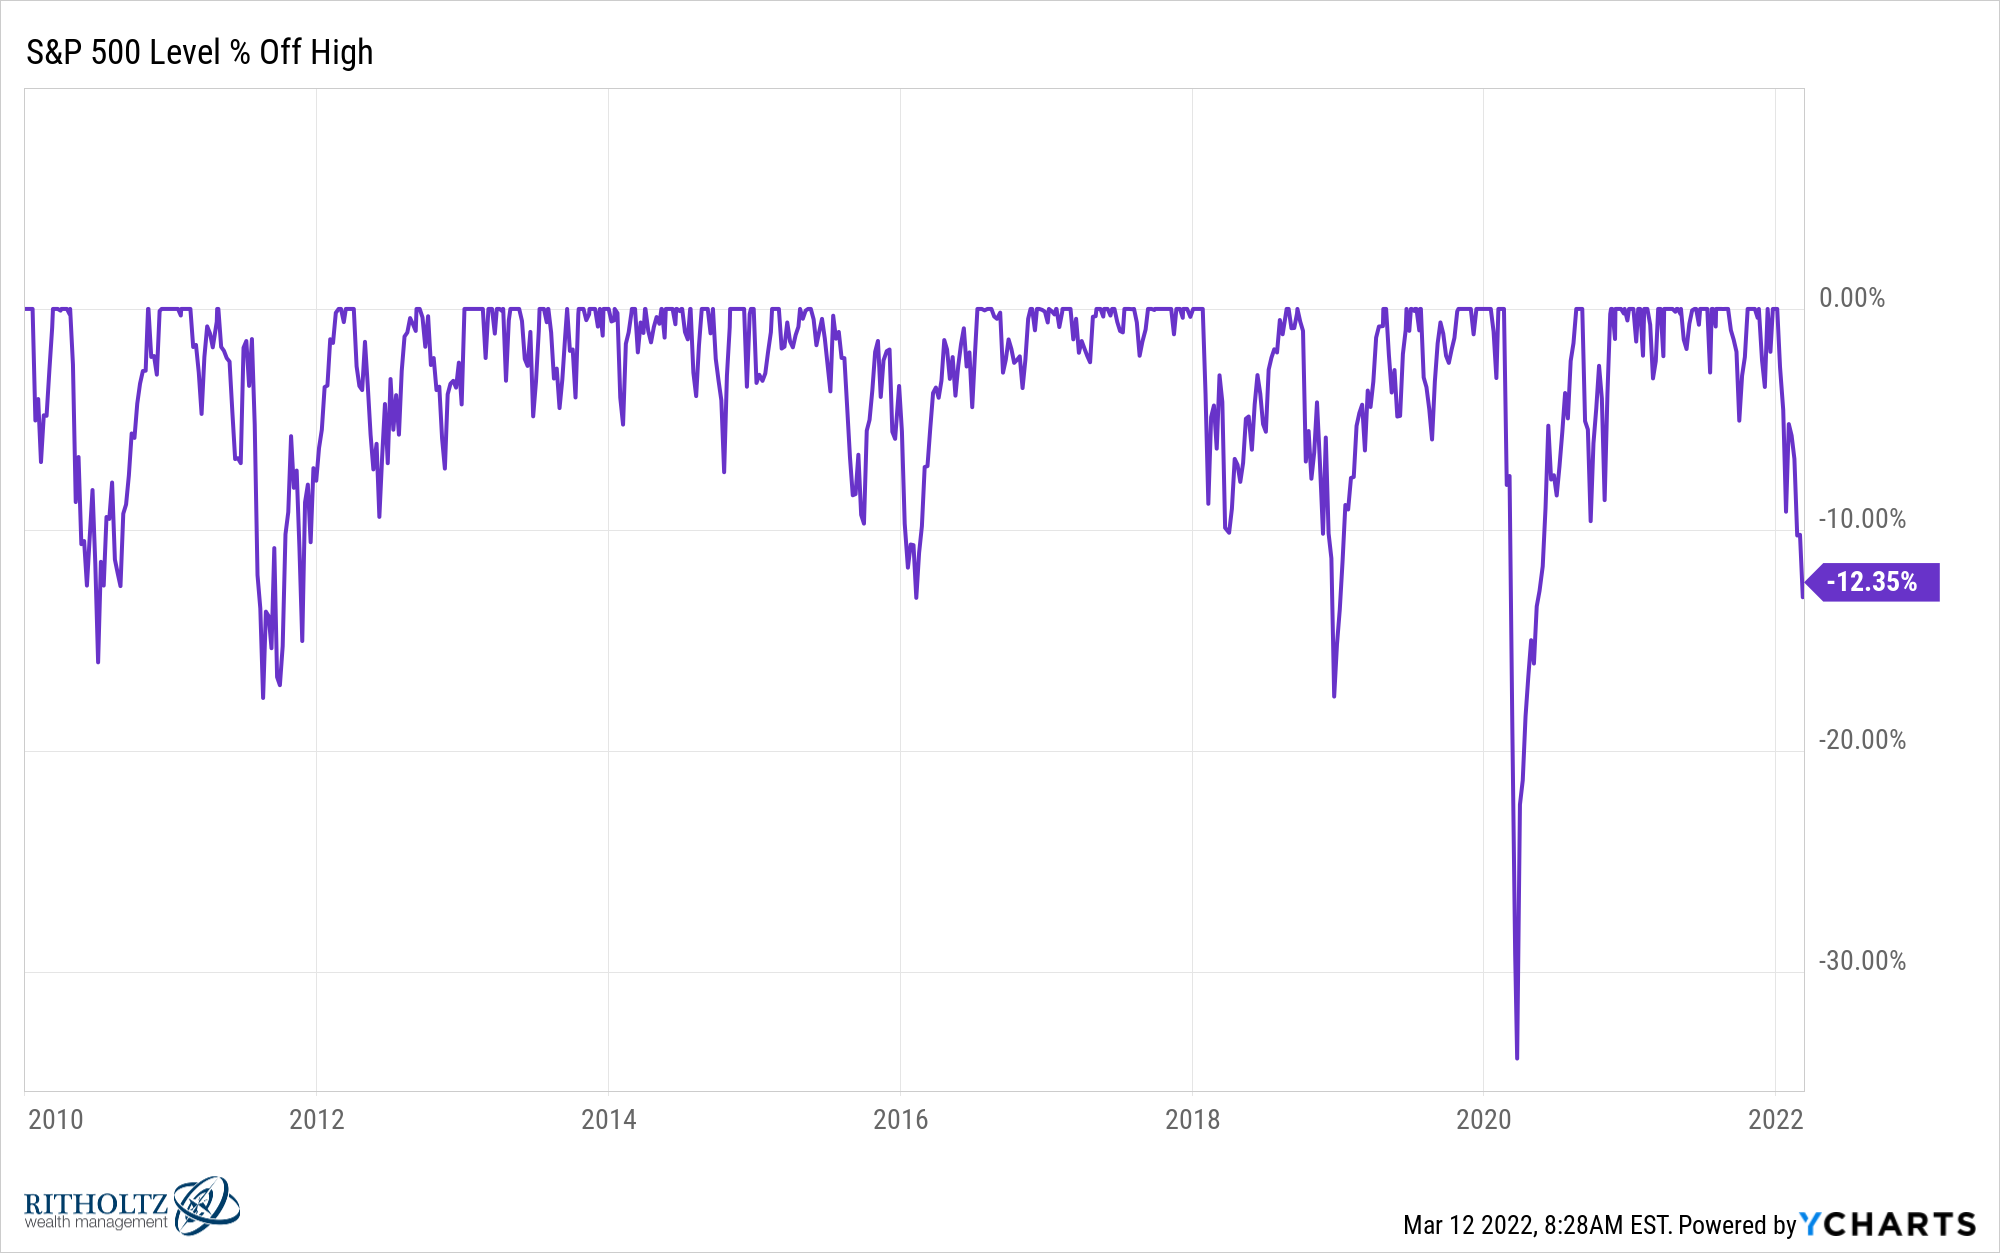
The Corona Crash saw the market fall 34% but we then had the fastest double from the bottom of a bear market in modern history.
We haven’t had an extended bear market since the 2007-2009 debacle that saw the S&P 500 fall more than 50% and take nearly six years to hit new all-time highs again.
Volatility test your emotions and intestinal fortitude. Extended downturns test your patience and resiliance.
I’m not sure how long this decline will last. I could end up being another V-shaped recovery.
But eventually we’re going to run into something that lasts longer than most investors expect.
Michael and I discussed the pros and cons of bear markets on this week’s Animal Spirits video:
Subscribe to The Compound so you never miss an episode.
Further Reading:
Returns From the Bottom of Bear Markets
Now here’s what I’ve been reading lately:
- 3 unfortunately timed trades (TKer)
- Zeikel’s rules (Reformed Broker)
- The Fed is in an impossible bind (Prag Cap)
- Big financial questions (Morningstar)
- There is always a reason to sell (Irrelevant Investor)
- Credit Suisse 2022 Investment Yearbook (CS)

