By my calculations, the Federal Reserve has raised their short-term benchmark interest rate — the Fed Funds rate — around 100 times since 1970.
That’s actually more than the 85 or so times they’ve lowered interest rates in that time.
The bulk of those rate increases took place between 1970 and 1984 when the Paul Volcker-led Federal Reserve was furiously raising rates to slow runaway inflation.
In early-1971, short-term rates were less than 4%. By 1981 they had skyrocketed to 20%. The Fed was not messing around. Rates were still close to 12% by 1984 and didn’t fall below 5% until 1991.
There’s a reason the Fed spent much of this time tightening monetary policy. Inflation average more than 7% a year from 1970 to 1984:

This is a period that included four recessions, two of which were more or less intentionally caused by the Fed (in the early-1980s).
If we break all these rate hikes over time into longer-term cycles there really haven’t been all that many. I count 8 of them since 1970. Here they are with corresponding stock market returns during those rising rates environments:
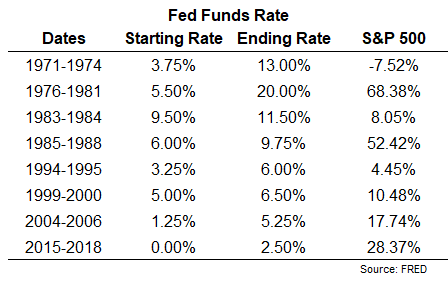
Surprisingly, stocks have held up relatively well during past hiking cycles. The average total return in these periods was 23%.
However, this data requires a dump truck of salt.
Stocks crashed almost 50% in 1973-74.
The market surged into 1981 but fell 27% in a brutal bear market that extended into 1982 (which included the aforementioned recession induced by the Fed).
The 1985-1988 period includes the biggest one day crash of all-time in October 1987, which saw the market fall 34% in a week.
The surprise rate hike in 1994 spooked the bond market as much as the stock market. The S&P 500 had a quick 8.5% correction in the early part of 1994 because of it but the aggregate U.S. bond market (-6.4%) and junk bonds (-7.7%) sold off nearly as much.
The Fed Funds rate remained elevated for much of the 1990s but was lowered following the Russian debt crisis of 1998. Rates were then raised again in the second half of 1999 through the first half of 2000 into the bursting of the dot-com bubble.
The market was cut in half in the 2000-2002 bear market.
Short-term rates reached their lowest levels ever (at the time) at 1% following the 2001 recession, stock market crash and 9/11. Then came the hiking cycle from 2004-2006. Stocks held up well in this period but peaked 15 months later before the Great Financial Crisis.
The next series of rate hikes started in 2015, after 7 years of 0% rates following the 2008 crisis. They only got as high as 2.5% before a near-bear market in stocks that bottomed on Christmas Eve 2018 when the Fed signaled they would change course.
So while the stock market has experienced relatively decent returns while the Fed has hiked in the past, the outcomes in and around those hiking cycles haven’t been all that great.
This makes sense when you think about the reasons for the Fed raising rates. It typically occurs when the economy is overheating, speculation is running rampant or inflation is above trend.
We hit 2 out of 3 which is the reason the Fed is going to embark on another series of rate hikes.
I suppose it’s possible investors know volatility tends to occur when the Fed raises rates so we’re getting it out of the way now.
Short-term rates have risen. Speculative stocks have gotten crushed and the stock market is in the midst of a minor correction.
And the crazy thing is the Fed hasn’t even raised rates yet!
Will this buy them some time? Will they be patient? Or does inflation have a bigger say this time around?
I honestly don’t know.
What I do know is rates are much lower than they were for the majority of hiking cycles in the past so it makes sense investors are nervous.
Think about the stock market like a very, very long duration bond.
When dealing with bonds, all else equal, the longer the duration, the higher the volatility, both to the upside and downside.
So a 30 year bond is going to see a much higher increase in price than a 2 year bond when rates fall. Alternatively, that same 30 year bond will see much larger losses than a 2 year bond when rates rise.
And volatility will be higher when rates are lower. If the prevailing interest rate is 7%, a 0.25% increase is relatively minor. But if market rates are at 1%, a 0.25% move is proportionally larger.
This doesn’t necessarily mean the end of the world but it makes sense the volatility is elevated.
Will this continue?
Again, I don’t know. I guess it depends on what’s priced into the stock market at this point.
Now it’s not just interest rates that matter in this equation. You could make the case it’s inflation that’s the biggest driver of volatility this time around.
And in my next piece, I’ll do just that. Stay tuned.
Further Reading:
Inflation Matter More For the Stock Market Than Interest Rates
