1995 might be the best year in U.S. stock market history.
It wasn’t the highest return ever in a calendar year (that was a 53% gain in 1954).
But it might be the least volatile year ever with an insanely high return. The S&P 500 was up 37.2% in 1995 while the largest peak-to-trough drawdown was a minuscule 2.5%.1 The worst single-day loss that year was just -1.5%.
There were also 77 new all-time highs in the index in 1995. I have data going back to 1928. That is by far the most new highs of any year I could find.
2021 wasn’t exactly as good of a year in stocks as 1995 but it was darn close.
Let’s look at the numbers.
The S&P 500 was up 28.7% including dividends. There have been 17 times since 1928 the market was up 30% or more so it’s not the best performance but considering it was up 12% in 2016, 22% in 2017, down 4% in 2018, up 31% in 2019 and up 18% in 2020, that’s not bad at all.
U.S. stocks are on a heckuva run of late.
In 2021 there were 70 new all-time highs. This number is shockingly high this far into a bull market. Put a pin in this one for a minute. We’ll come back to it.
The worst peak-to-trough drawdown in 2021 was just 5.2%. That puts it in the bottom 10% of all calendar year drawdowns over the past 94 years of data. The worst down day was a loss of just 2.6%.
So we just had a year in which the S&P 500 hit a new record high in nearly one-third of all trading days, losses were capped at 5% and the index was up nearly 30%.
In the grand scheme of things, 2021 was in the neighborhood of the best years in U.S. stock market history, which occurred in the 1950s and 1990s, two of the greatest bull markets of all-time.
While researching the data on new all-time highs I couldn’t help but compare this current period with those prior bull runs.
Look at the number of new all-time highs in the S&P 500 by decade going back to the 1950s2:
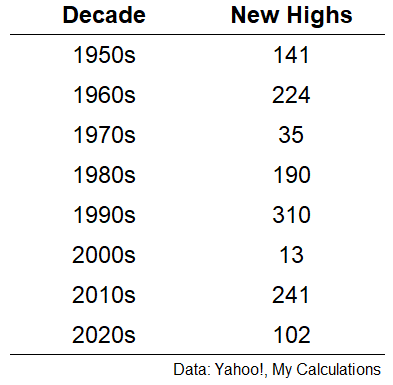
There were more new all-time highs in 2021 than the entire decades of the 1970s and the 2000s combined.
Let me repeat that one for effect. There were more new all-time highs in 2021, 13-ish years into a bull market, than the 20 years combined in the 1970s and 2000s.
This is fun with numbers of course since those decades were awful in the market, but still pretty crazy nonetheless.
Since taking out the late-2007 highs in 2013 there have now been 343 record highs during this bull market.
The bull market of the 1950s and 1960s bull had a combined 365 new highs. The 1980s and 1990s bull saw 500 new all-time record highs.
The annual returns from the bottom in March 2009 now rival both of those glorious bull markets. It’s exceedingly impressive considering the number of people who have been pessimistic this entire run-up and all that we’ve had to deal with along the way.
So where does the current bull rank historically?
Is it time to start comparing the current run to the greatest bull markets of all-time?
Is this beginning to look like the 1950s and 1990s?
I have some thoughts on these questions but it’s going to require a follow-up blog post.
I can’t give a two sentence answer to the Jordan vs. LeBron debate when it comes to historical stock market returns.
In my next piece, I’ll give the tale of the tape to compare how the current bull market ranks historically.
In the meantime, if you were a buy-and-hold investor in the U.S. stock market in 2021, give yourself a pat on the back.
You just lived through one of the greatest years of all-time in the stock market.
It’s not always going to be this easy.
Further Reading:
All-Time Highs Are Both Scary and Normal
1That is the smallest drawdown in a calendar year I could find going back to 1928.
2I have the data for the 1930s and 1940s but didn’t need to include them since there were no new all-time highs in those decades. In fact, the September 1929 high seen before the onset of the Great Depression didn’t get taken out until 1954.

