Since I wrote this piece a couple of weeks ago there have been 7 additional all-time highs in the S&P 500, making it 26 and counting for 2019. Every time the market hits all-time highs it feels like the end is near and the peak is here.
The majority of the time that’s just not the case and all-time highs are followed by more all-time highs. Here’s the data in a piece I wrote for Fortune.
*******
Plenty of investors have a hard time figuring out how the stock market continues to charge higher in the face of trade wars and impeachment hearings. Maybe the simplest explanation is new highs in the stock market are typically followed by more new highs, regardless of what’s happening in geopolitics.
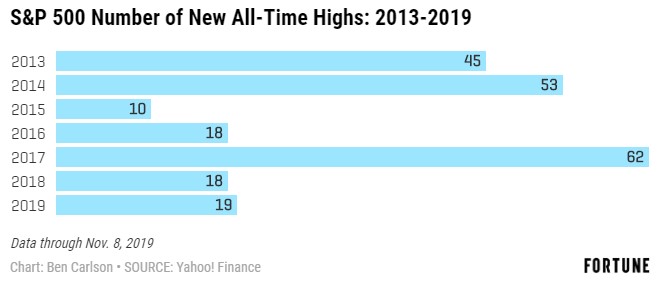
The S&P has now hit 19 and counting new all-time highs in 2019 alone. And that’s following 18 new all-time highs in 2018, 62 in 2017, 18 in 2016, 10 in 2015, 53 in 2014, and 45 in 2013. Because of the financial crisis, 2013 was the first time the S&P had reached new highs since peaking in 2007.
One of the hardest parts about investing in the stock market is there is always something to worry about. This is true even when things are going well, as they are now with markets at or near all-time highs depending on the day.
Roughly 5% of all trading days for the U.S. stock market have seen a new all-time high since 1928. You can look at this one of two ways: (1) All-time highs are perfectly normal in the stock market given they happen 1 out of every 20 trading days throughout history. (2) If 5% of all trading days close at all-time highs, that means the other 95% of days are in a state of drawdown.
Since World War II, the stock market has spent nearly 40% of the time within 5% of all-time highs while 54% of the time stocks have closed within 10% of an all-time high. The inverse of this would mean almost half the time stocks are in a double-digit drawdown throughout history. Part of the reason for this is the fact that stocks can go long stretches of time between new highs.
Here are the number of all-time highs in the S&P 500 by decade through November 8, 2019:
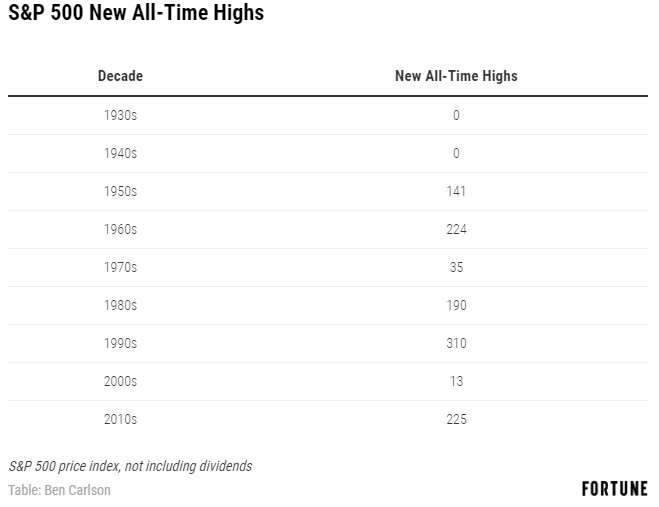
You can see no new highs in the 1930s or 1940s. In fact, because of the severity of the Great Depression market crash, there were no new all-time highs following the peak in the fall of 1929 until the fall of 1954. That’s more than 25 years from peak to peak! Now, these numbers are using the price level only, not including dividends, which were much higher back then. But the point remains that there can be long droughts.
The problem we face as investors when dealing with all-time highs in the stock market is twofold. First, new all-time highs tend to cluster as strong performance often begets more strong performance in the markets. Rising markets attract buyers because investors are human. But eventually one of these all-time highs will be THE all-time high that will remain in place for some time. And those long clusters of highs can be followed by periods like the 1970s or 2000s where stocks rarely hit new highs because they were littered with nasty bear markets.
So on the one hand, don’t be afraid of all-time highs. If you plan on being in the stock market over the long-term, you’re going to have to get used to the fact that stocks mostly go up over time and new highs are completely normal. In fact, following an all-time high, stocks are up roughly 70% of the time going out one, three and five years into the future.
On the other hand, the reason 1 out of every 20 days has been a new all-time high historically is because you can’t set your watch to it. Eventually, one of these highs will be the top. Just know that there are so many highs in the market that it’s impossible to predict with any degree of certainty which one that will be.
This piece was originally published at Fortune. Re-posted here with permission.
