We finally had some volatility in the markets this year after an extraordinarily calm 2017. Investors seem to worry under both scenarios. When volatility is low, the worry is that it will pick up in the future. And when volatility spikes, the worry is that it will continue. The truth is both periods of subdued volatility and craziness in the markets are both perfectly normal. This is how markets function over time. The following piece I wrote for Bloomberg looks at how the volatility of the economy may or may not be impacting volatility in the stock market.
*******
Many predicted that the beginning of last year would finally bring an uptick in volatility. Instead, 2017 was one of the least volatile periods on record for the stock market. The S&P 500 was up every month. The largest peak-to-trough drawdown was slightly more than 3 percent, the lowest on record since at least the mid-1990s.
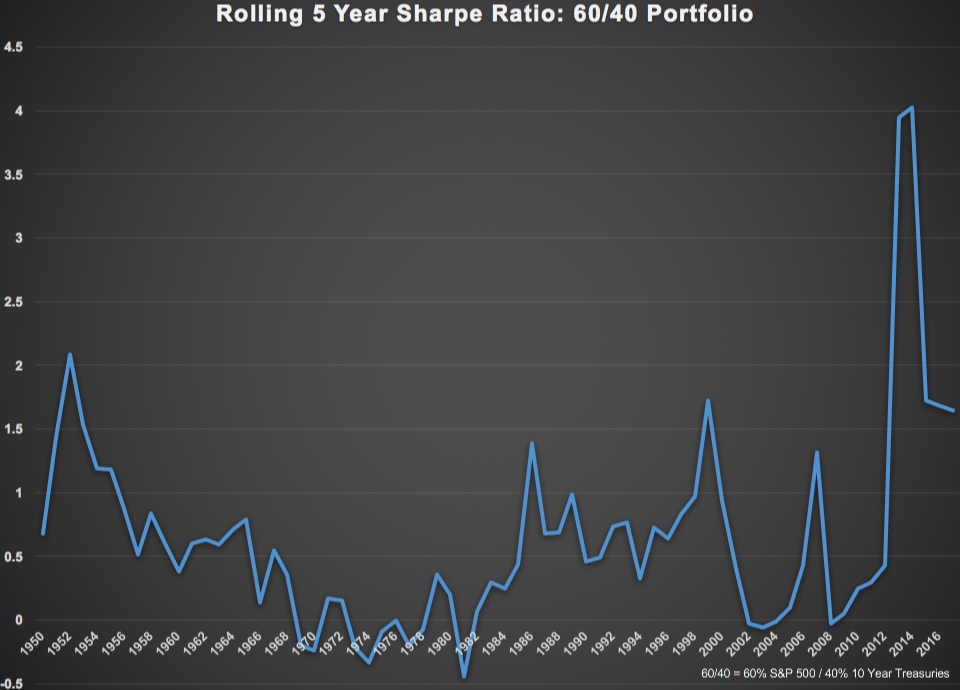
And this phenomenon isn’t limited to 2017. Volatility has been subdued for the majority of the recovery since early 2009. A look at the Sharpe Ratio, a measure of volatility per unit of return above the performance of cash, shows that on a simple 60/40 stock/bond portfolio this cycle has produced some of the best risk-adjusted returns on record since 1950:
Investors, pundits and economists have all been trying to figure out why stocks and bonds have provided a smooth ride for a number of years. How have risk assets managed to stay so calm through what many people consider to be one of the most volatile geopolitical periods in some time?
The first lesson is that political volatility doesn’t necessarily translate into market volatility. Investing ideas and political beliefs are rarely a profitable combination. Markets are discounting mechanisms and don’t always react to news or events in the way most people would assume.
There has also been very little economic volatility. It’s now been more than eight years since the last recession. Although it hasn’t been as strong as economic recoveries in the past, this one has been relatively stable. Many assumed economic volatility was here to stay following the most recent recession, but we’ve had a calm economic environment for some time now.
Using rolling five-year volatility on real gross domestic product growth rates since the late 1940s shows this has been one of the least volatile economic periods in some time:
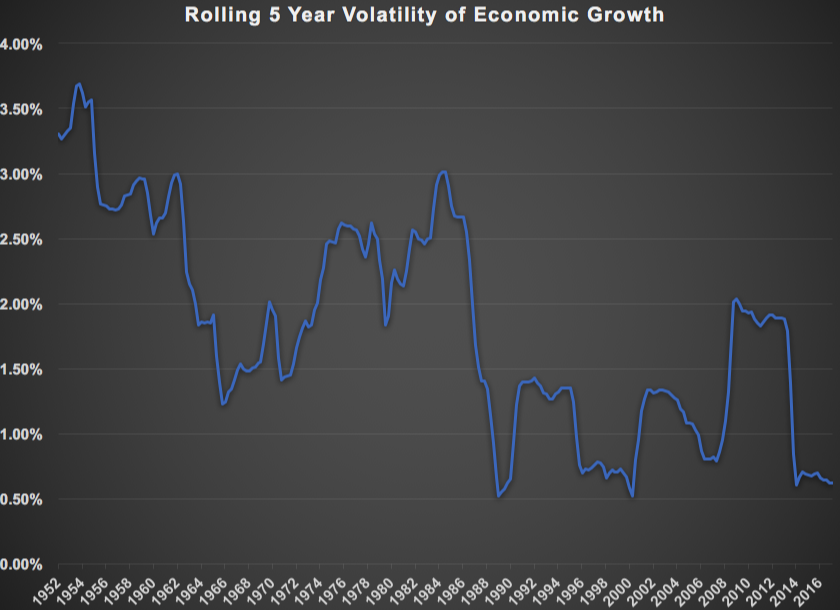
In fact, although there have been spikes during each of the past two recessions, economic volatility has been trending downward for decades. This period is close to matching the late 1980s and late 1990s with some of the lowest economic volatility on record. The biggest problem is that although growth has been consistent, it has also been relatively anemic. And one of the reasons growth was more volatile in the past is because there was more of it. The following table on real GDP growth by decade shows how things have slowed over time in terms of both the absolute levels of real GDP growth and its volatility:
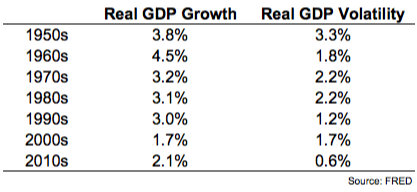
Volatility of economic growth has declined over time, but so has the actual growth. One of the reasons it’s been so tough for experts and pundits to get a read on the economic backdrop is because the volatility has been so low. Things just haven’t gotten too hot or too cold in this recovery, so economic bulls and bears have both had plenty of chances to be wrong. Everyone expects a huge move one way or the other, and that just hasn’t happened yet.
Data from the asset manager Research Affiliates also shows a relationship between macroeconomic volatility and stock market valuations:
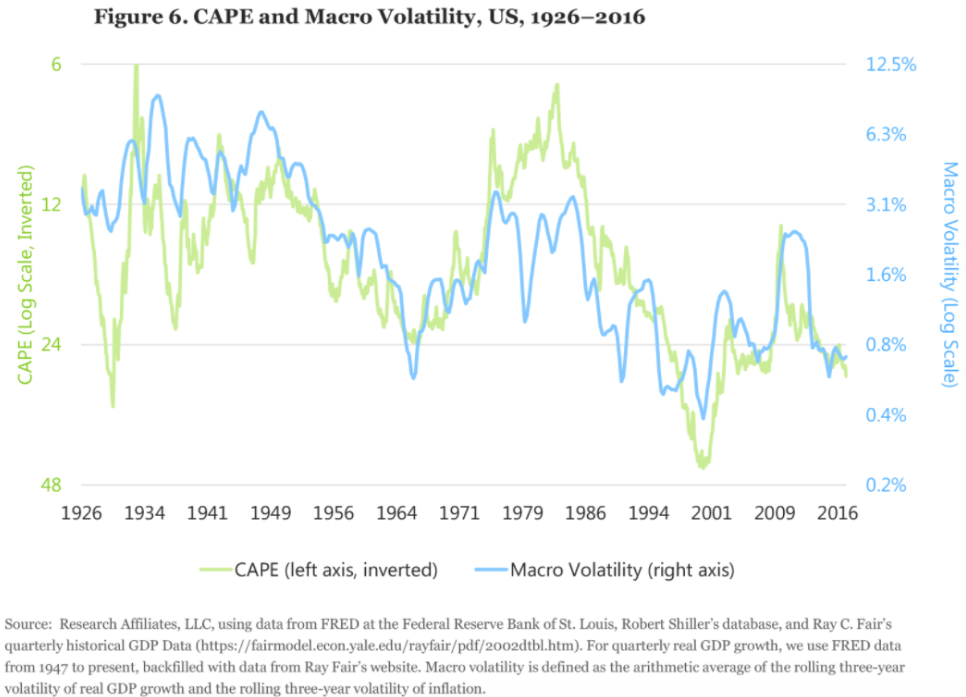
This chart shows the volatility of GDP data plotted against the inverse of the cyclically adjusted price-to-earnings ratio, or CAPE. Their thesis is that lower macro risk over time has made investors more comfortable with higher valuation levels in stocks.
Of course, volatility won’t stay low forever. In the short to intermediate term, there can be large divergences between stocks and the economy. The chart below shows the rolling 30-day volatility on the S&P 500 going back to 1950:
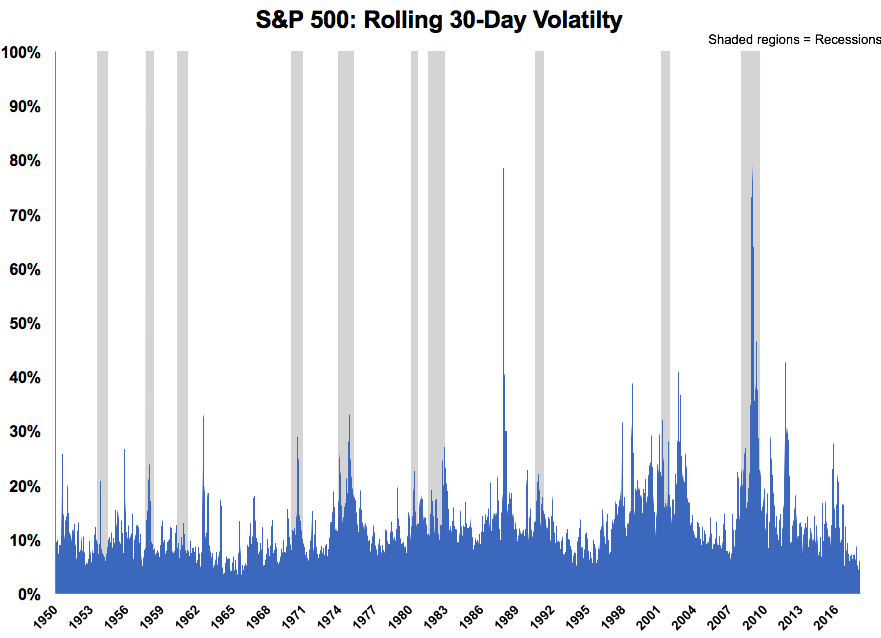
Although most of the upticks in volatility occurred in concert with a recession, there were plenty of spikes that occurred outside of an economic contraction. At a certain point, stability itself can create instability when investors become too complacent in a low-volatility regime. For example, GDP only contracted by 5.1 percent during the last recession but stocks fell by more than 50 percent. Investors tend to take things too far in both directions as the recency bias causes us to use our recent experience as a baseline for what will happen in the future indefinitely.
So while low macroeconomic volatility has likely played a role in the muted stock market volatility, it certainly won’t last forever. The old joke is that the stock market has predicted nine out of the last five recessions. Eventually, investors will look for an excuse to run for the exits, allowing panic and volatility to rule the day once again. The hard part in all of this is figuring out the trigger that causes this to happen.
Originally published on Bloomberg View in 2018. Reprinted with permission. The opinions expressed are those of the author.
