I think over the holidays my house set a new world record for most consecutive days of Amazon deliveries in a row. I buy everything from Amazon — clothes, shoes, books, technology, cleaning supplies, furniture, household goods, food, drinks and pretty much anything else you can think of.
For many of these goods, I save money by using the subscribe & save feature. I use Amazon Prime to have everything shipped in 1-2 days so I never have to wait too long (I also use Prime to watch TV shows and movies). And I put it all on my Amazon credit card which saves me an extra 5% on all purchases.
Amazon is the first place I look to price check just about anything I buy these days.
Obviously, I’m not alone here. Visual Capitalist had a pretty telling chart on how Amazon has affected the rest of the retail market:
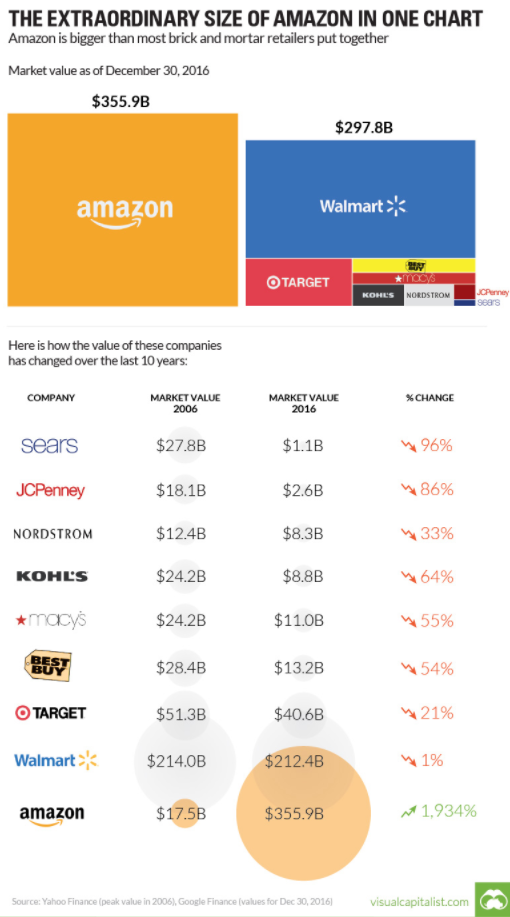
It’s not a perfect comparison by any means because Amazon does some things most of these other companies don’t (cloud service, streaming video, tablets, etc.), but anyway you look at it these numbers are pretty insane.
Walmart’s market cap has more or less stayed the same, while everyone else besides Amazon has gotten destroyed. But it’s worth remembering that the returns to an investor aren’t simply calculated on a share price or market value scale. You also have to take into account factors such as share buybacks and dividends. So I took a look at the actual total stock market performance of each of these companies (I also added in Costco and Bed Bath & Beyond) over the past 10 years through the end of 2016:
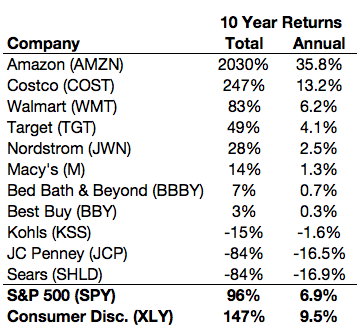
You can see that Amazon and Costco have completely left everyone else in the dust while Walmart did manage to earn a similar return as the S&P 500. It would seem that scale and customer experience have given both Amazon and Costco and enormous advantage over the competition in the past decade.
Just to make sure you don’t assume these huge gains in Amazon have come easy, my colleague Michael Batnick looked how difficult it would have been for investors had they held on for the entire ride up in Amazon stock since its IPO in 1997:
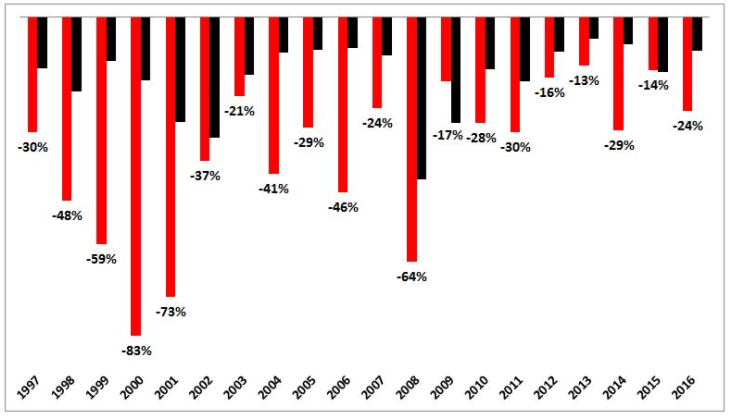
This chart shows the average intra-year drawdowns for both Amazon and the Dow. Amazon averaged a 36% drawdown each of the past 20 years.
Amazon the stock obviously can’t keep up the same pace over the next 10 years, but regardless of what the stock does from here, I can’t imagine that the company won’t continue to steal share from the rest of the retail world. My condensed take on why Amazon is eating the retail world:
- Jeff Bezos
- Better user experience
- Superior distribution channels
- Better customer service
- Lower prices
- More selection
- Faster delivery
- Saves you the time and headache of going to an actual store
- It’s simple
Sources:
The Extraordinary Size of Amazon in One Chart (Visual Capitalist)
Looking for the Next Amazon
Further Reading:
The Most Complicated Stocks
