Since bottoming last March following the Corona Crash, the S&P 500 is up nearly 80%.
And other than a brief downturn in September, the rise has gone on more or less unabated in terms of corrections:
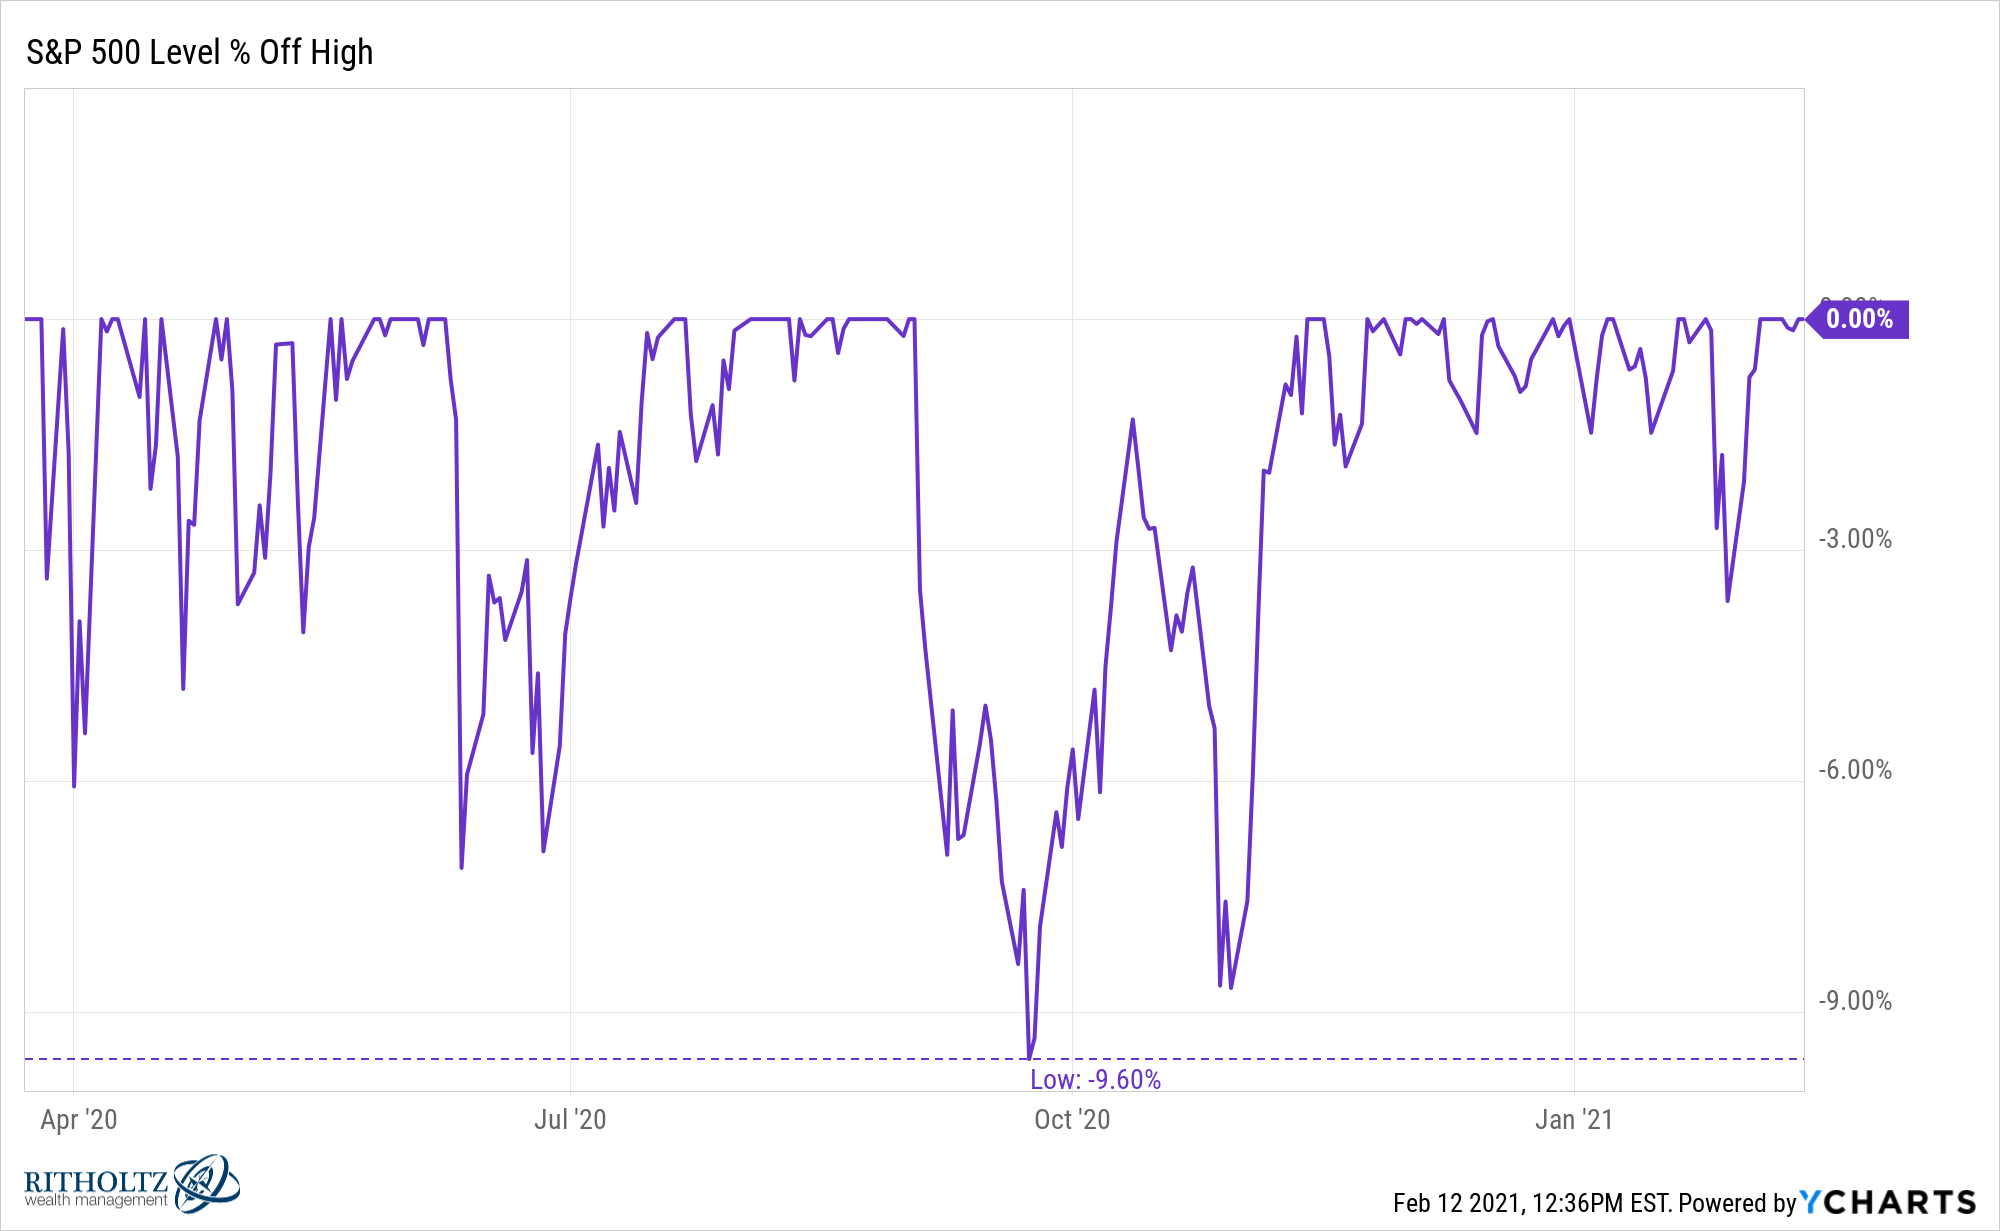
Since 1950, the S&P 500 has experienced 36 double-digit drawdowns. That works out to one every other year or so on average.
So maybe we’re closing in on being due for a breather but these things don’t occur on a set schedule.
The stock market has been highly volatile since the turn of the century, experiencing crashes of 50%, 57% and 34%. It’s possible this level of heightened volatility is going to remain for the foreseeable future with an assist from the internet.
But markets can go through extremely long runs in-between sell-offs.
The longest the stock market has gone without a double-digit correction since 1950 is 7 years from 1990-1997.
Then from 2002-2007 there was a four-and-half-year drought with no corrections.
This may surprise some people, but the third-longest streak of no market corrections over the past 70 years or so was the four years from late 2011 through late-2015.
Here’s the full list since 1950 (corrections in blue and bear markets in red):
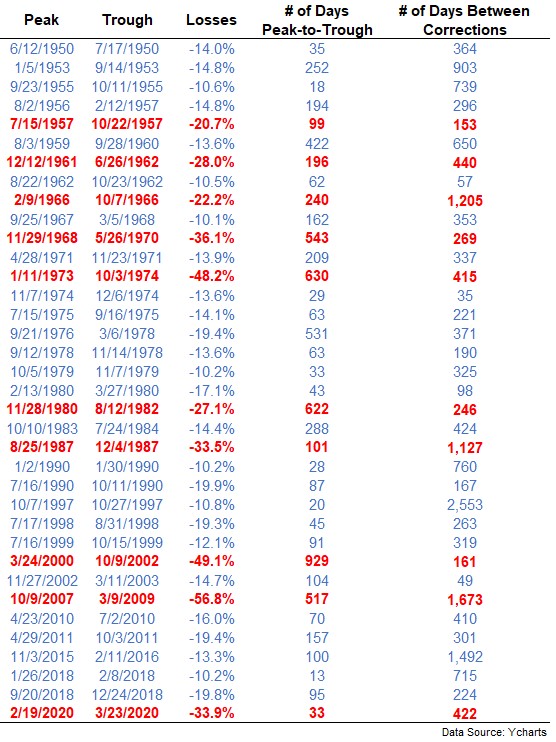
While double-digit corrections occur quite frequently, bear markets are more infrequent.
There have been 10 bear markets since 1950, meaning they have hit once every seven years, on average.
The longest time from bear market to bear market in modern market history was the 12 years and 4 months between the 1987 crash and the onset of the dot-com crash in 2000.1
Then there were the 11 years from the bottom in 2009 through the start of the Corona Crash last February.2
So you could be right about a coming market crash but have to wait a loooooong time for it to come.
And if you plan on waiting for a correction it’s not only time you could be missing out on but massive returns. These are the biggest gains on the S&P 500 that occurred between double-digit corrections:
1990-1997: +302%
1984-1987: +147%
2003-2007: +112%
2011-2015: +109%
This is why market timing can be such a destructive exercise. There can be a massive opportunity cost if you’re wrong.
Maybe markets are moving faster than they did in the past. Maybe we’ll have more corrections and bear markets because technology is speeding things up.
But don’t underestimate the market’s ability to continue rising. This is what makes predicting the stock market so difficult.
You always have to be prepared for a downturn but there are also times where markets scream higher without much resistance.
Further Reading:
How Long Does It Take To Make Your Money Back After a Bear Market?
1To be fair there were two 19%+ corrections in this time so maybe I’m splitting hairs here but they don’t technically fit the 20% definition of a bear market. I don’t make the rules.
2Again there were two 19% and change corrections in this time.

