According to the Wall Street Journal the United States is facing a historic housing shortage:
At the end of July, there were 1.3 million single-family existing homes for sale, the lowest count for any July in data going back to 1982, according to the National Association of Realtors.
The pandemic obviously has a lot to do with this considering the home has become such an important piece of our lives in 2020. It’s not only where you live but can also be where you work, workout and spend the majority of your social life.
It’s also true that many young people would have purchased a home in the coming years regardless of a pandemic because that’s what people do when they get older. The combination of these two factors has propelled the real estate market to new heights in the midst of a recession.
Beyond the pandemic and demographics, it can be helpful to view the United State real estate market through historical charts to get a better sense of the trends that have been in place for some time.
The existing home months’ supply is the lowest it’s been since they started collecting this data in the late-1990s:
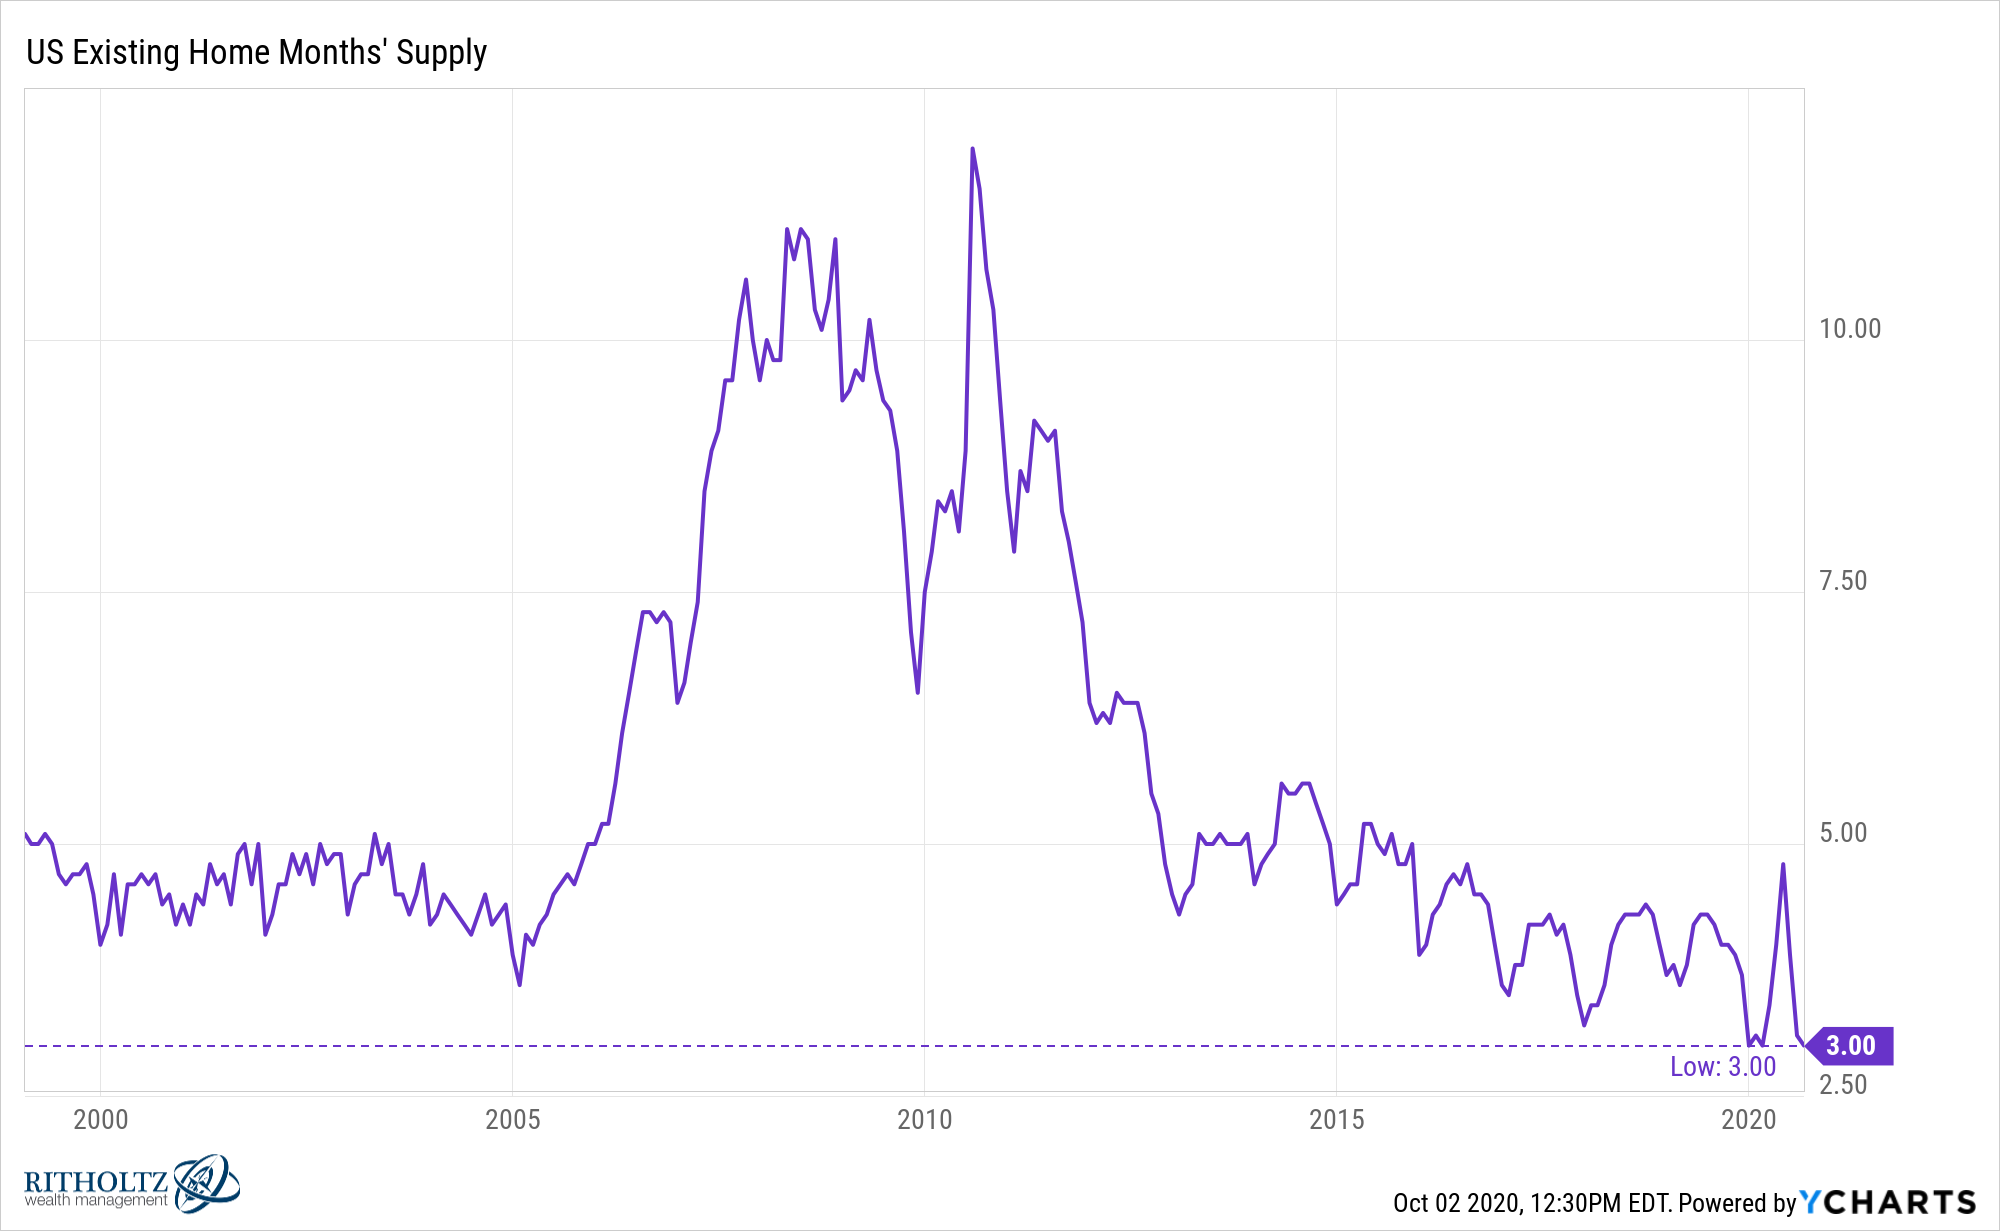
Houses are going quickly.
You can see the enormous spike following the bursting of the real estate crisis. Had you told people following the Great Financial Crisis of 2008 that the next recession would include a housing boom I’m not sure anyone would have believed you.
We built our current home in 2017. In talking with our builder, he told us things were so bad in the aftermath of the financial crisis he had to completely shut down his home building company in Michigan and move it to Florida to find any clients.
Lucky for us he decided to bring the company back but it’s not surprising homebuilders are still gun-shy about building more new homes:
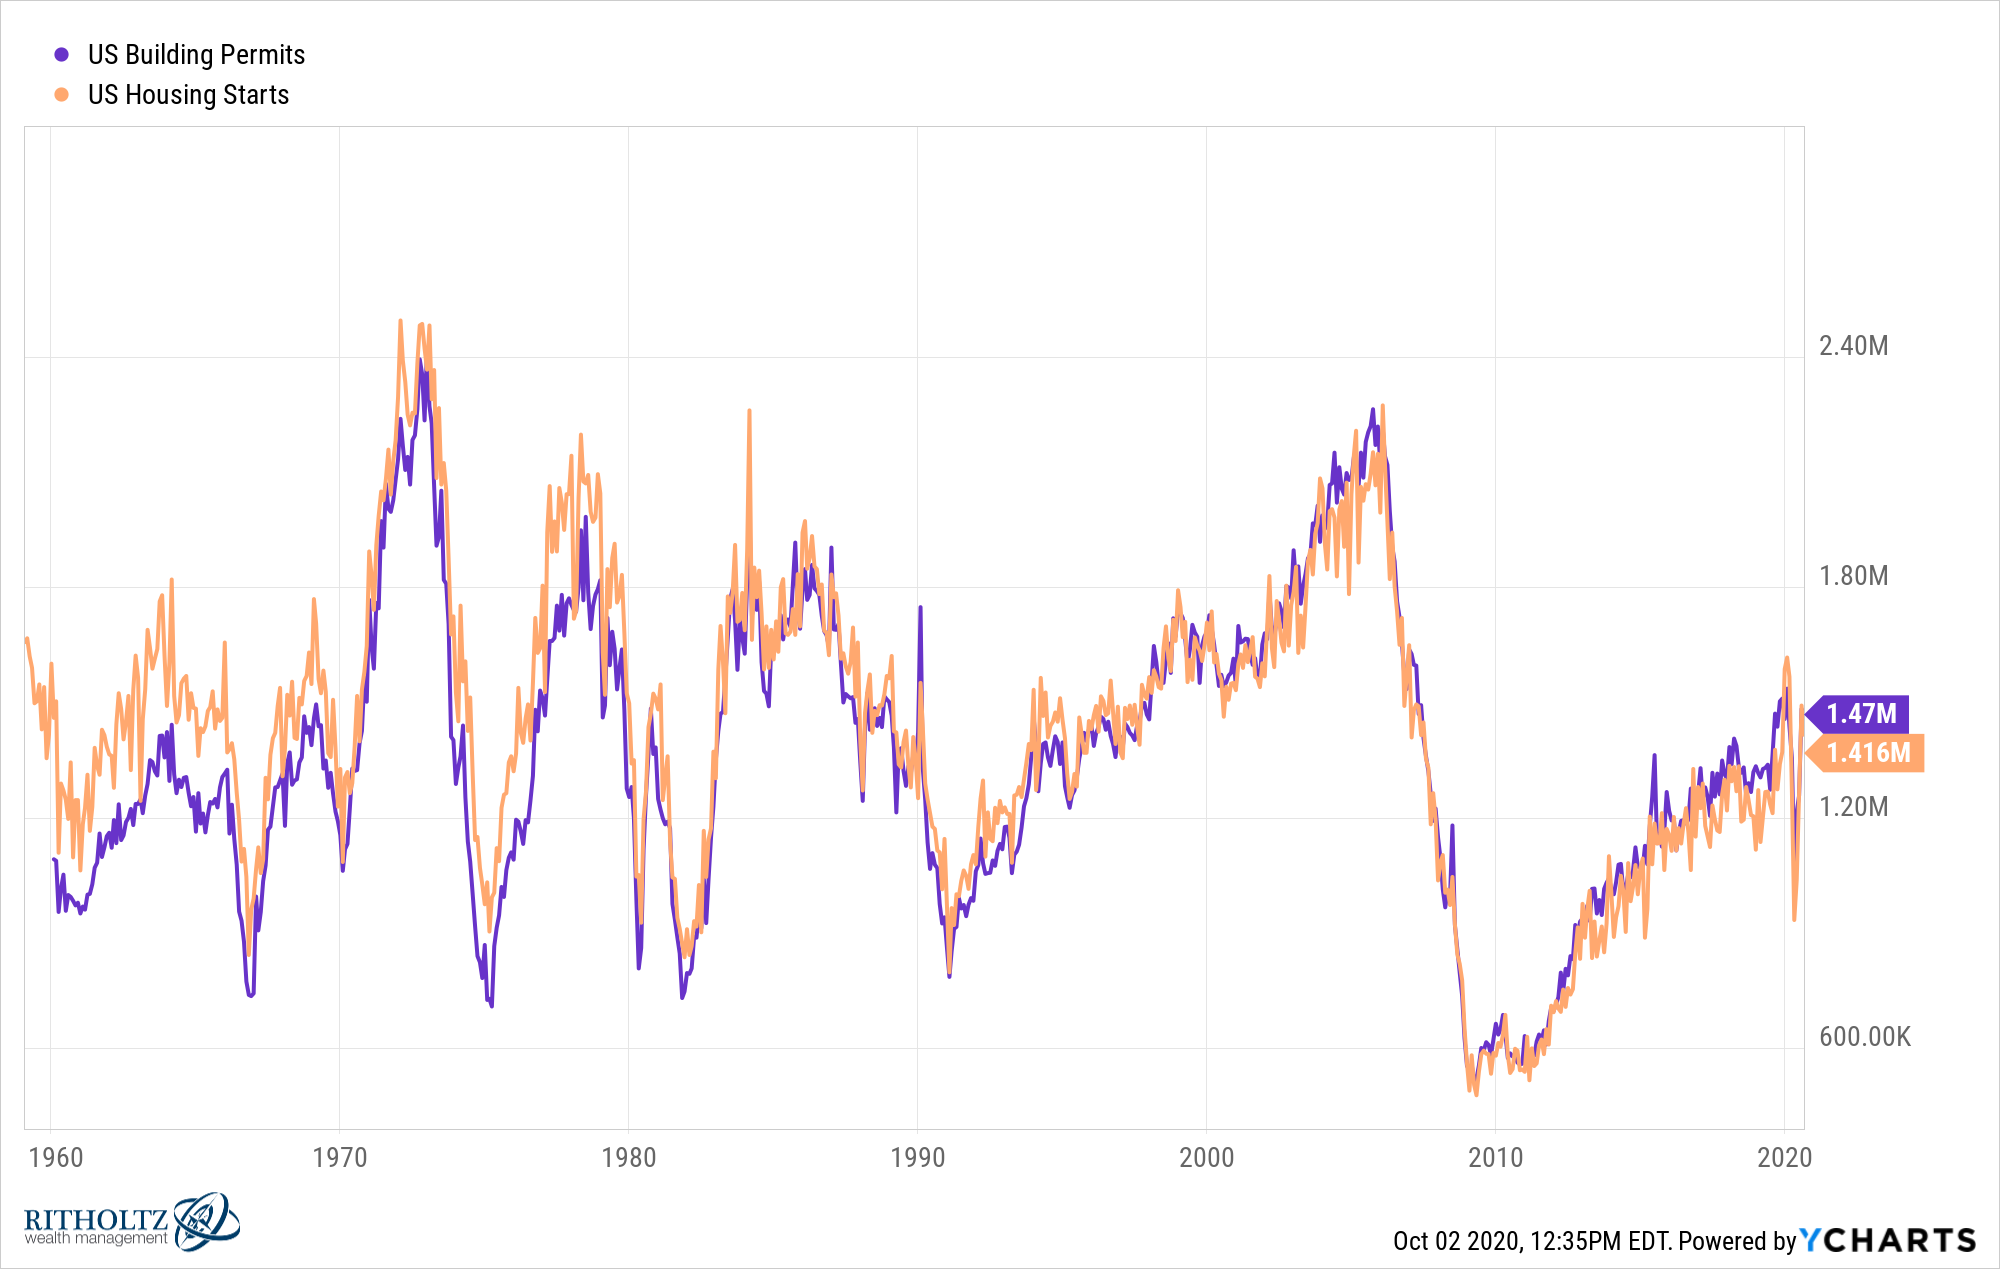
Housing starts and building permits are still well off their highs from 2006:
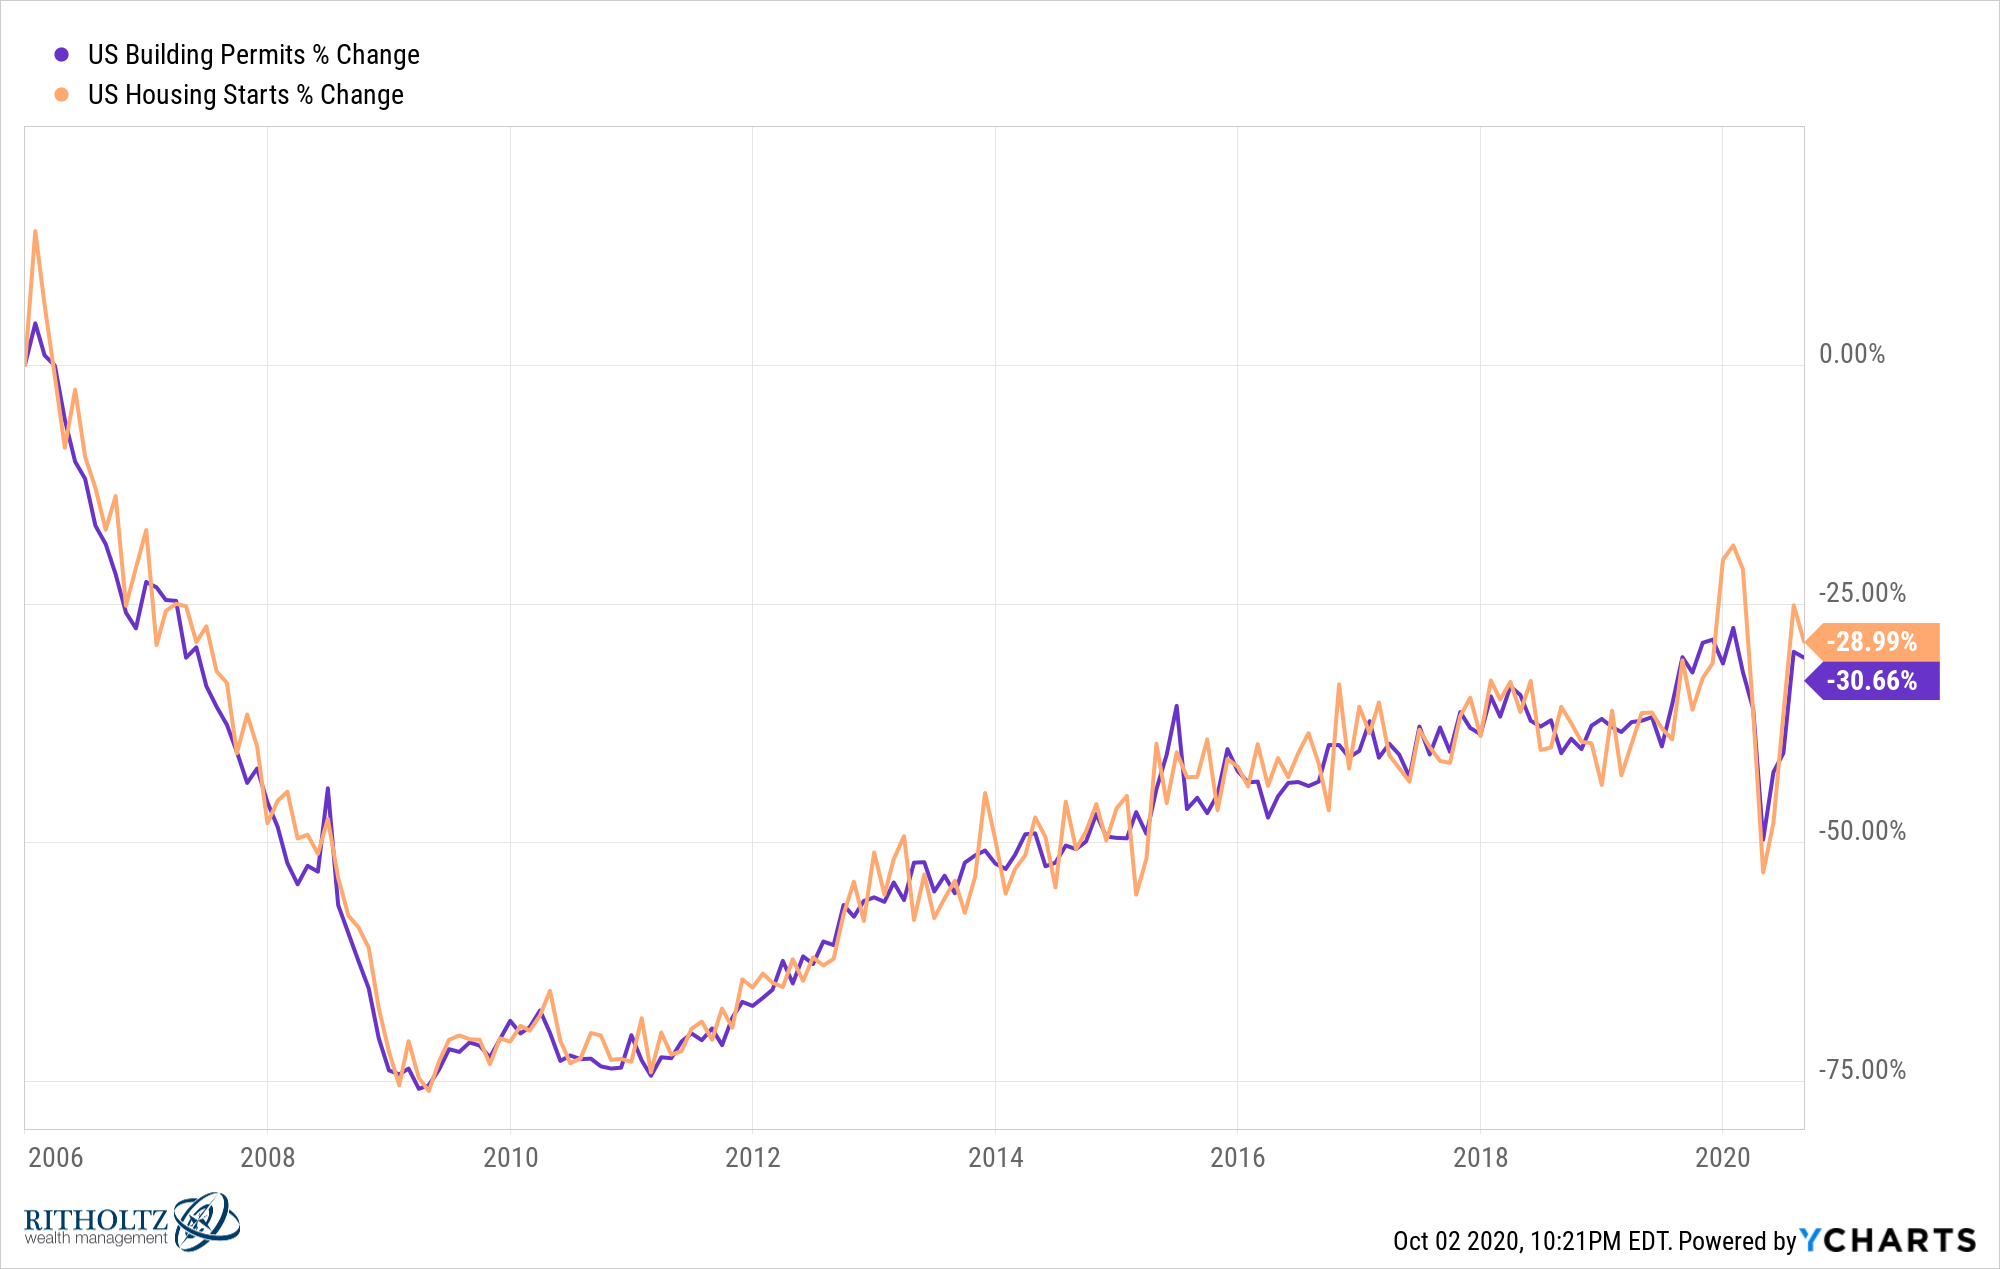
Making this comparison to the highs of a real estate bubble may not be a great baseline but this just goes to show you how dangerous it can be to mix human nature in the supply and demand equation.
There were too many homes built during the bubble days of the early-to-mid 2000s while the pendulum has swung too far in the other direction now and there aren’t nearly enough homes being built.
Inventories for new and existing homes are going in the wrong direction if you’re someone looking to buy at the moment:
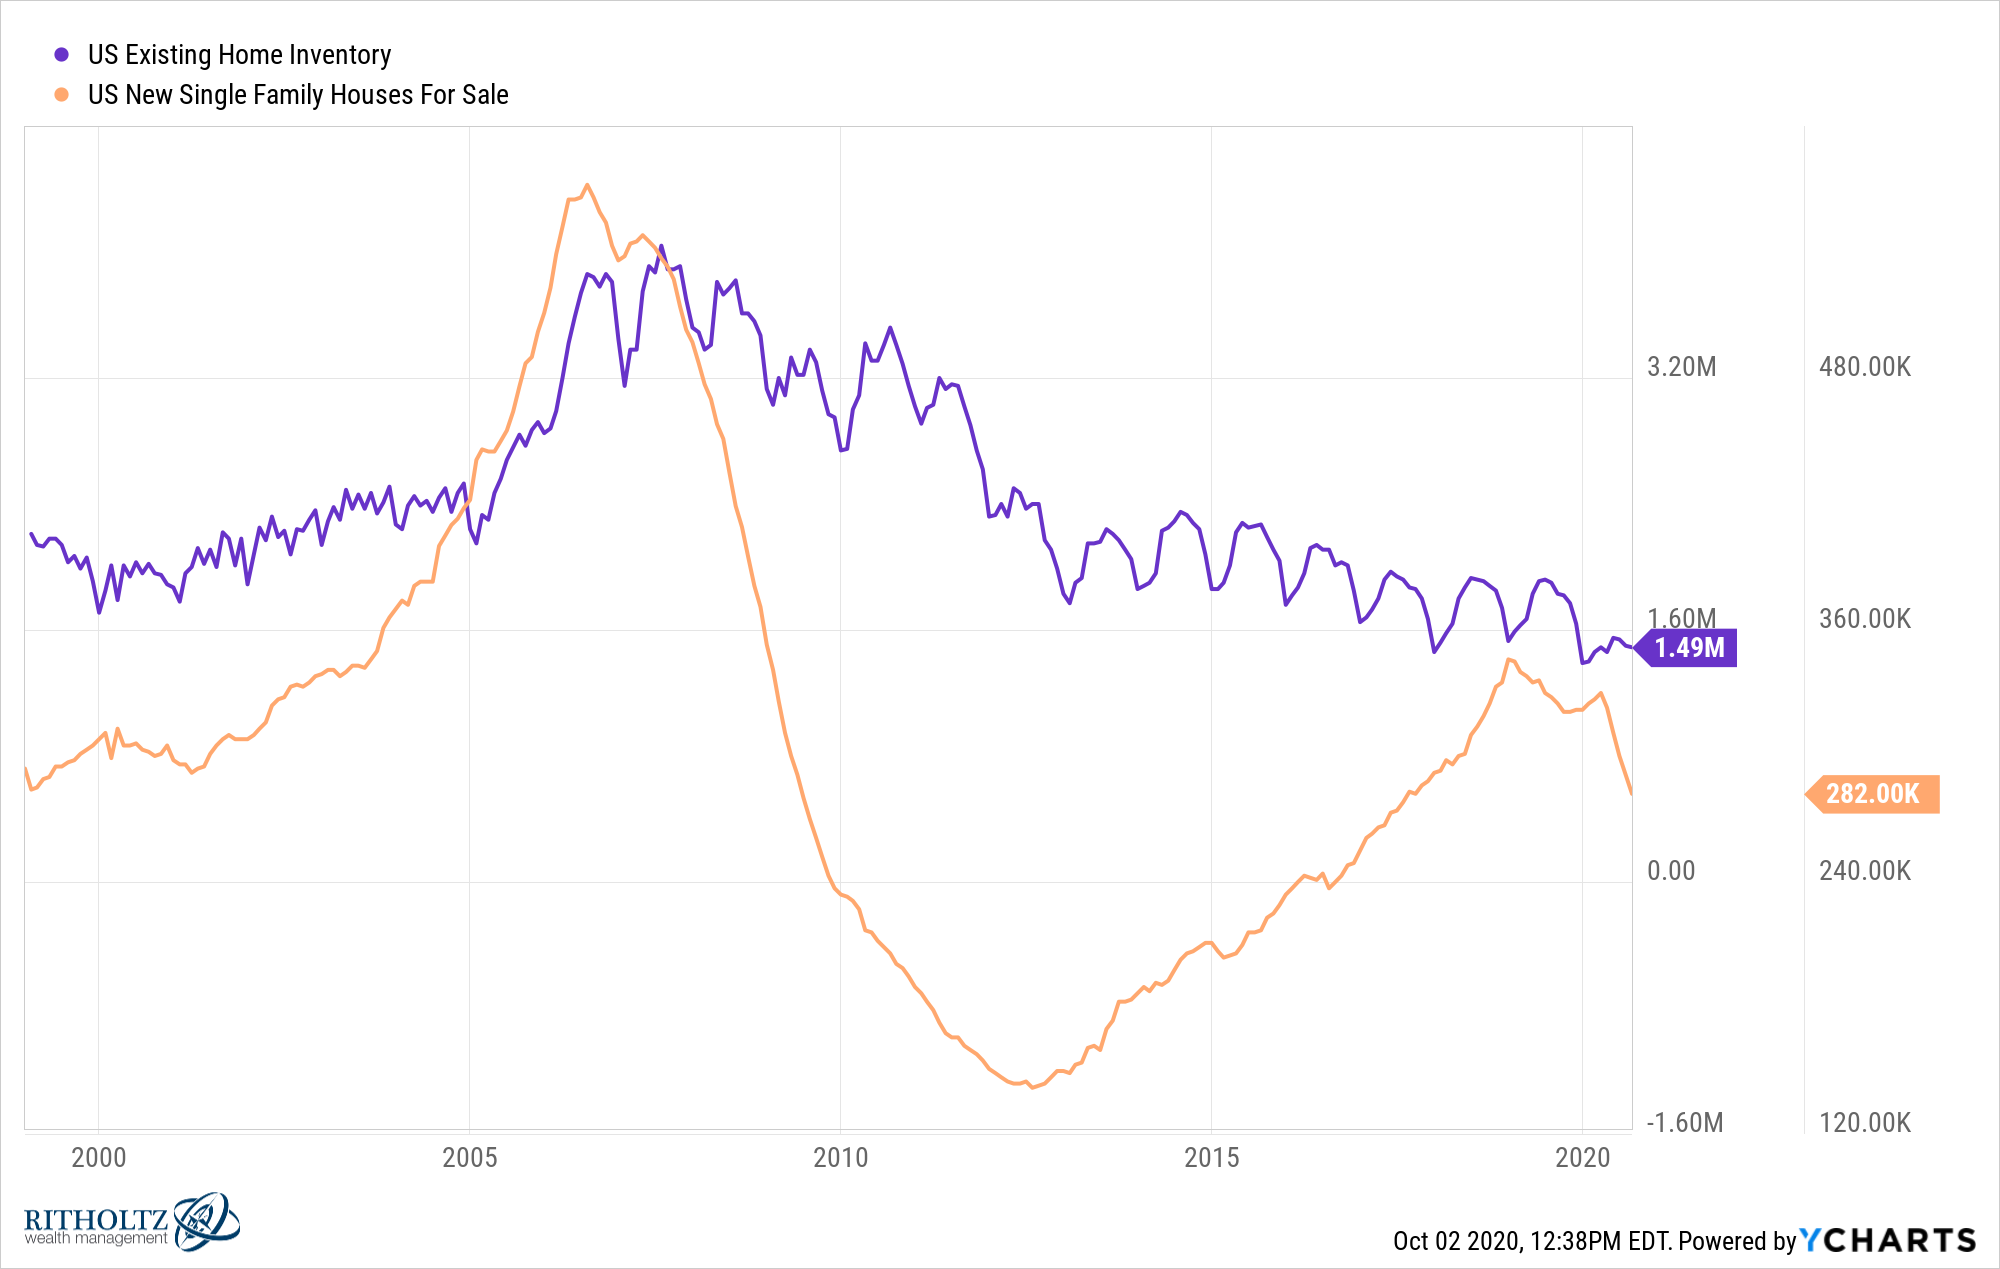
There are pros and cons to both a buyer’s and seller’s market depending on which side of the aisle you’re on.
From 2007 until 2013 or so, there wasn’t much competition for homebuyers. This made it easier to negotiate a good deal as a buyer but also made it harder to sell relatively quickly if you were looking to get out of your current home.
My wife and I bought our first home at the end of 2007 and we were able to make an offer on a place that had seen the price drop multiple times after sitting on the market for more than a year. And it was new construction.
That’s not going to happen in today’s market.
The Bozeman Daily Chronicle had a story this past week discussing the plight of the first-time homebuyer in Gallatin Valley Montana, which has seen the median price of a single-family home rise from $487,000 to more than $575,000 since this summer alone.
The supply-demand imbalance makes it impossible for most buyers to even contemplate their offer since there’s so much competition:
It’s not uncommon for a house listed to have six or seven offers by the end of the first day on the market, he said. If a buyer wants a home, they have to be ready to put an offer in right away, and there’s a good chance they’ll competing with a cash buyer. In the 16 years Dobrenski has been in real estate in the valley, people buying homes in cash has remained around one-third of buyers.
“We have a huge amount of buyers, we really do, and not a fraction of the homes we need to be able to satisfy that need,” Dobrenski said. “I feel so bad for those first-time home buyers, because they’re so excited and yet they want to think about it and, unfortunately, they don’t have a lot of time to think about it.”
This year is a perfect example of why you shouldn’t try to guess the future but there’s a solid case to be made that the period following the last crisis may have been a generational buying opportunity in housing:
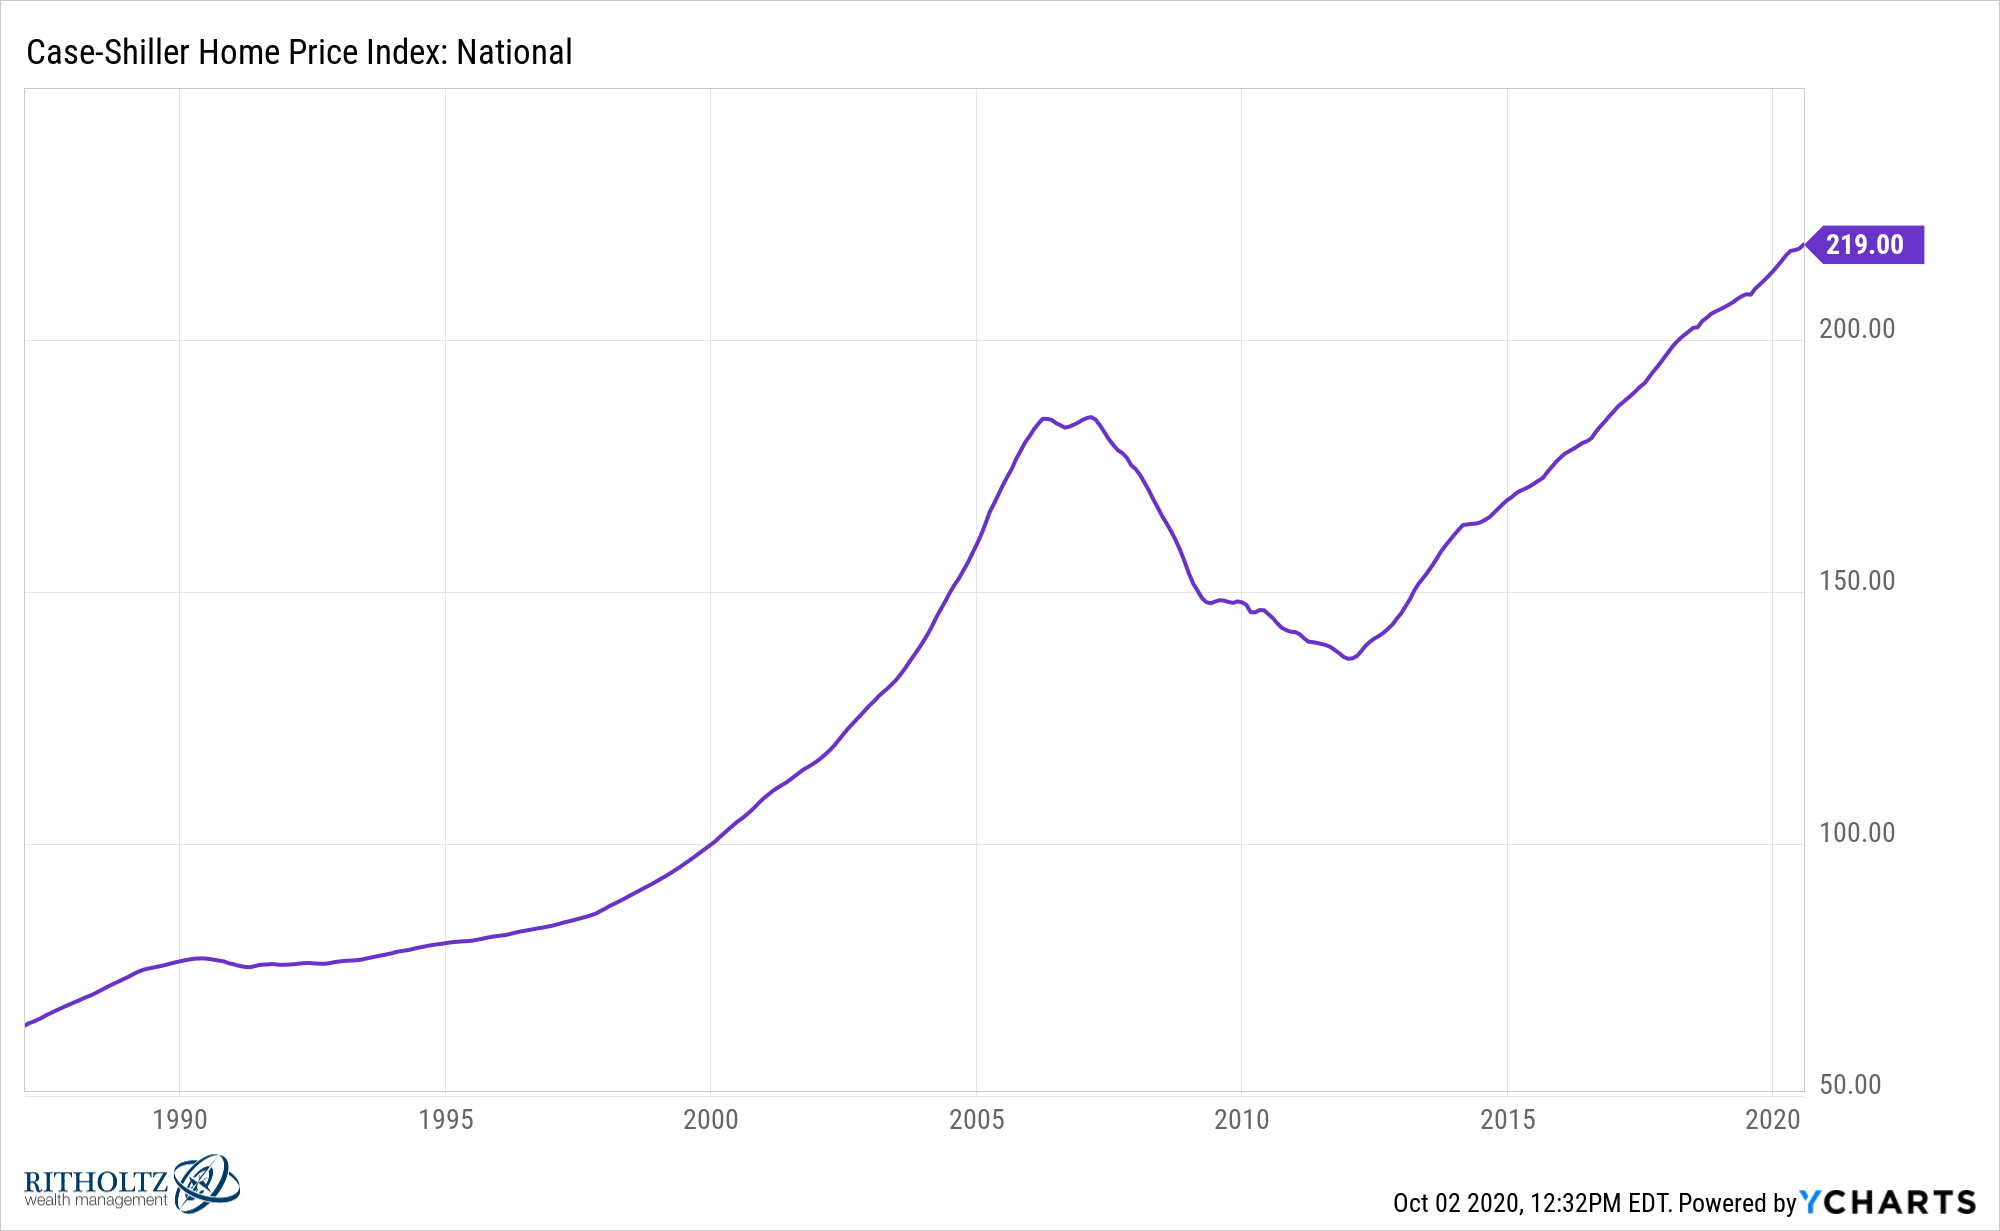
Obviously, so much of this depends on your location and idiosyncratic risks but there’s a case to be made that by 2030 or so people are going to be kicking themselves if they didn’t buy in the 2010s because prices and rates were so much lower.
Studying the history of real estate in the U.S. from the likes of Robert Shiller has informed me housing has not been the greatest investment historically because it more or less keeps up with inflation. This isn’t necessarily a bad thing but many people would be surprised to know the long-term history isn’t as great as some believe.
But since the 1990s, housing has handily outpaced inflation:
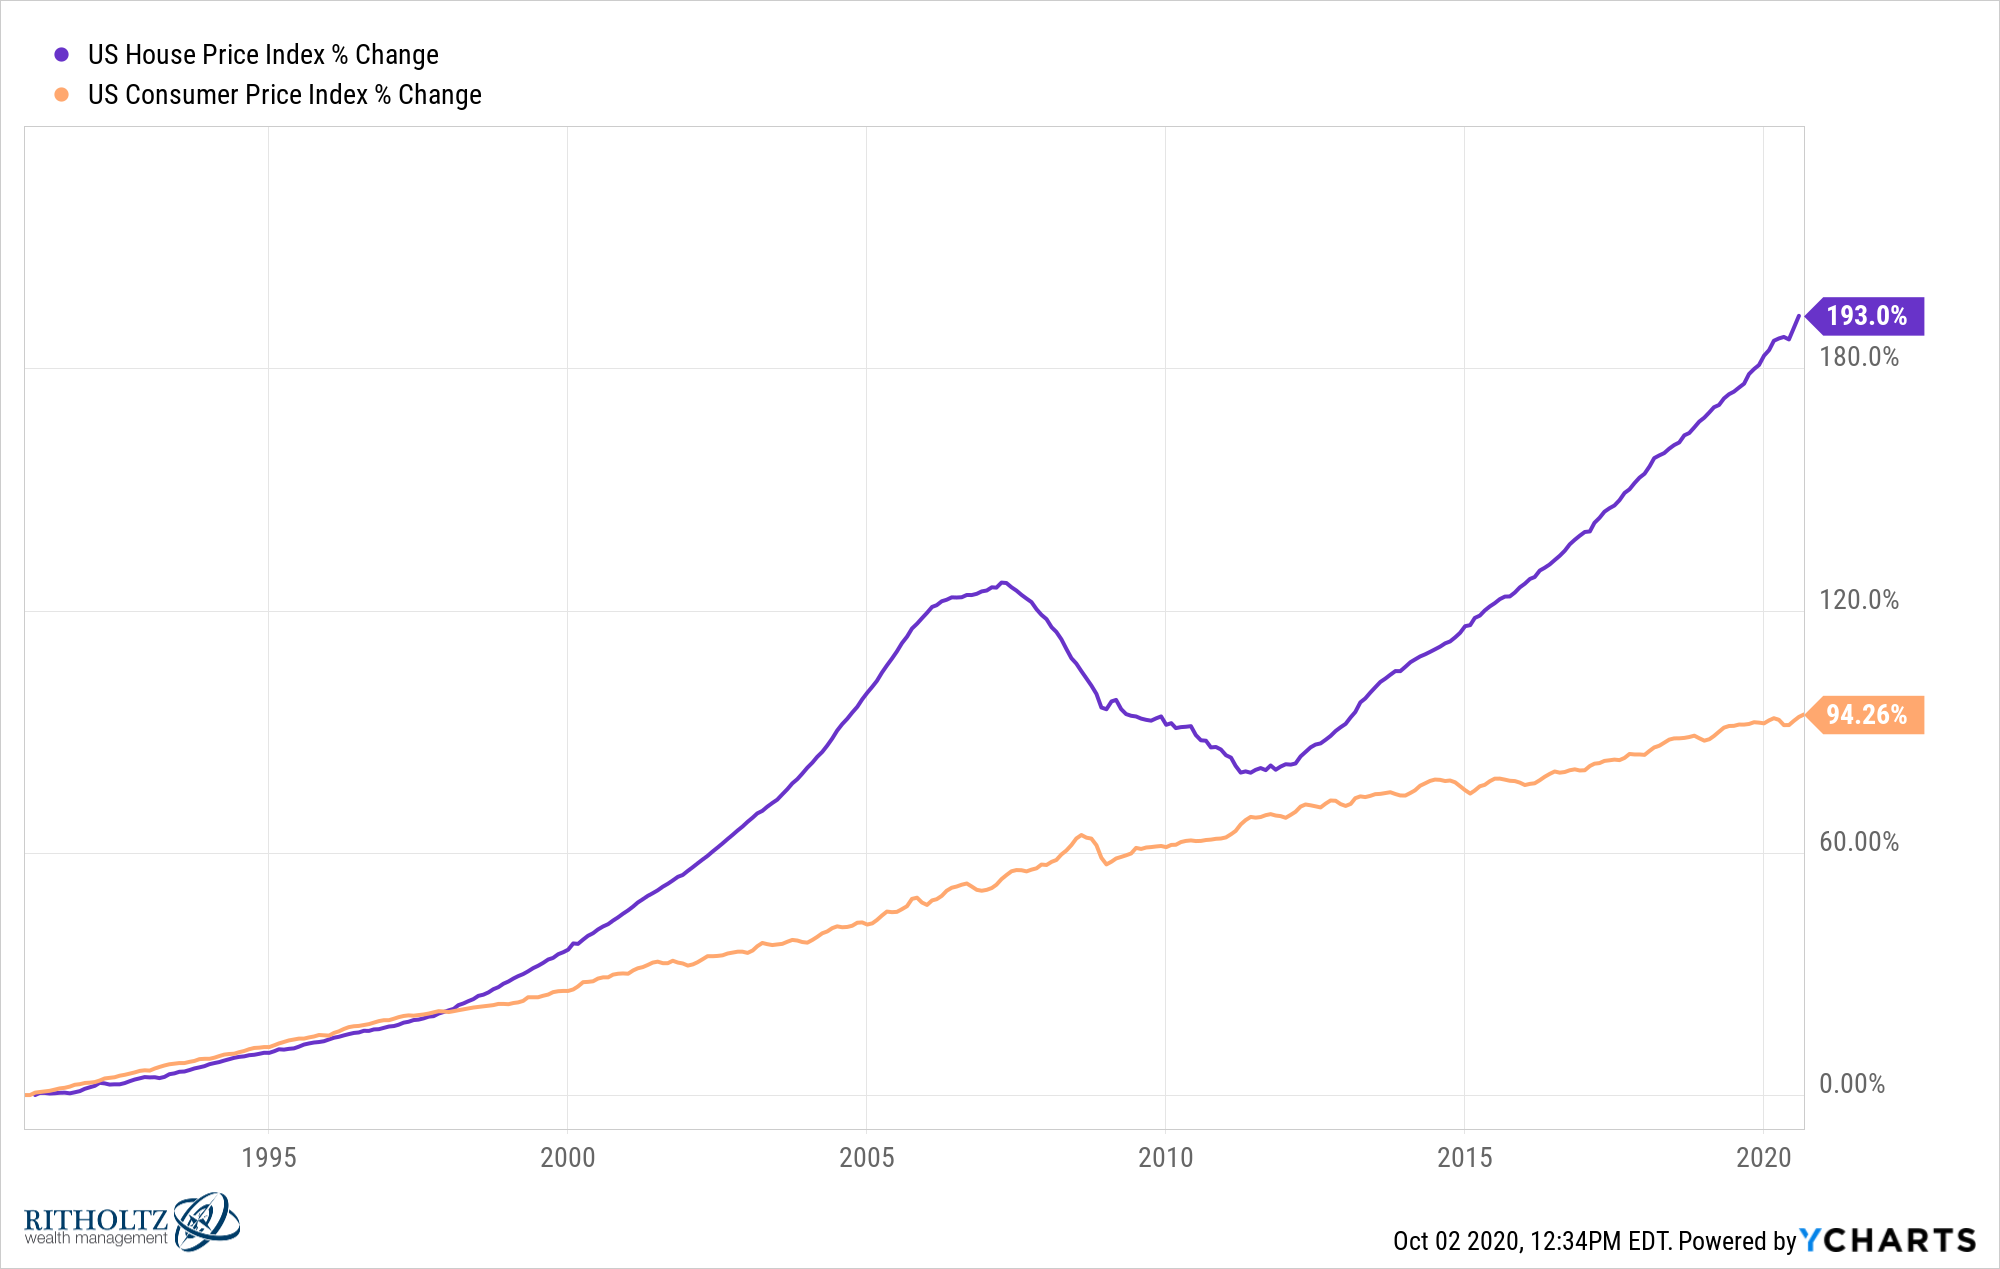
Maybe the long-term relationship has changed and housing will provide more protection against inflation than it has in the past?
It’s possible.
Another wild chart from the pandemic shows the massive increase in homeownership this year:
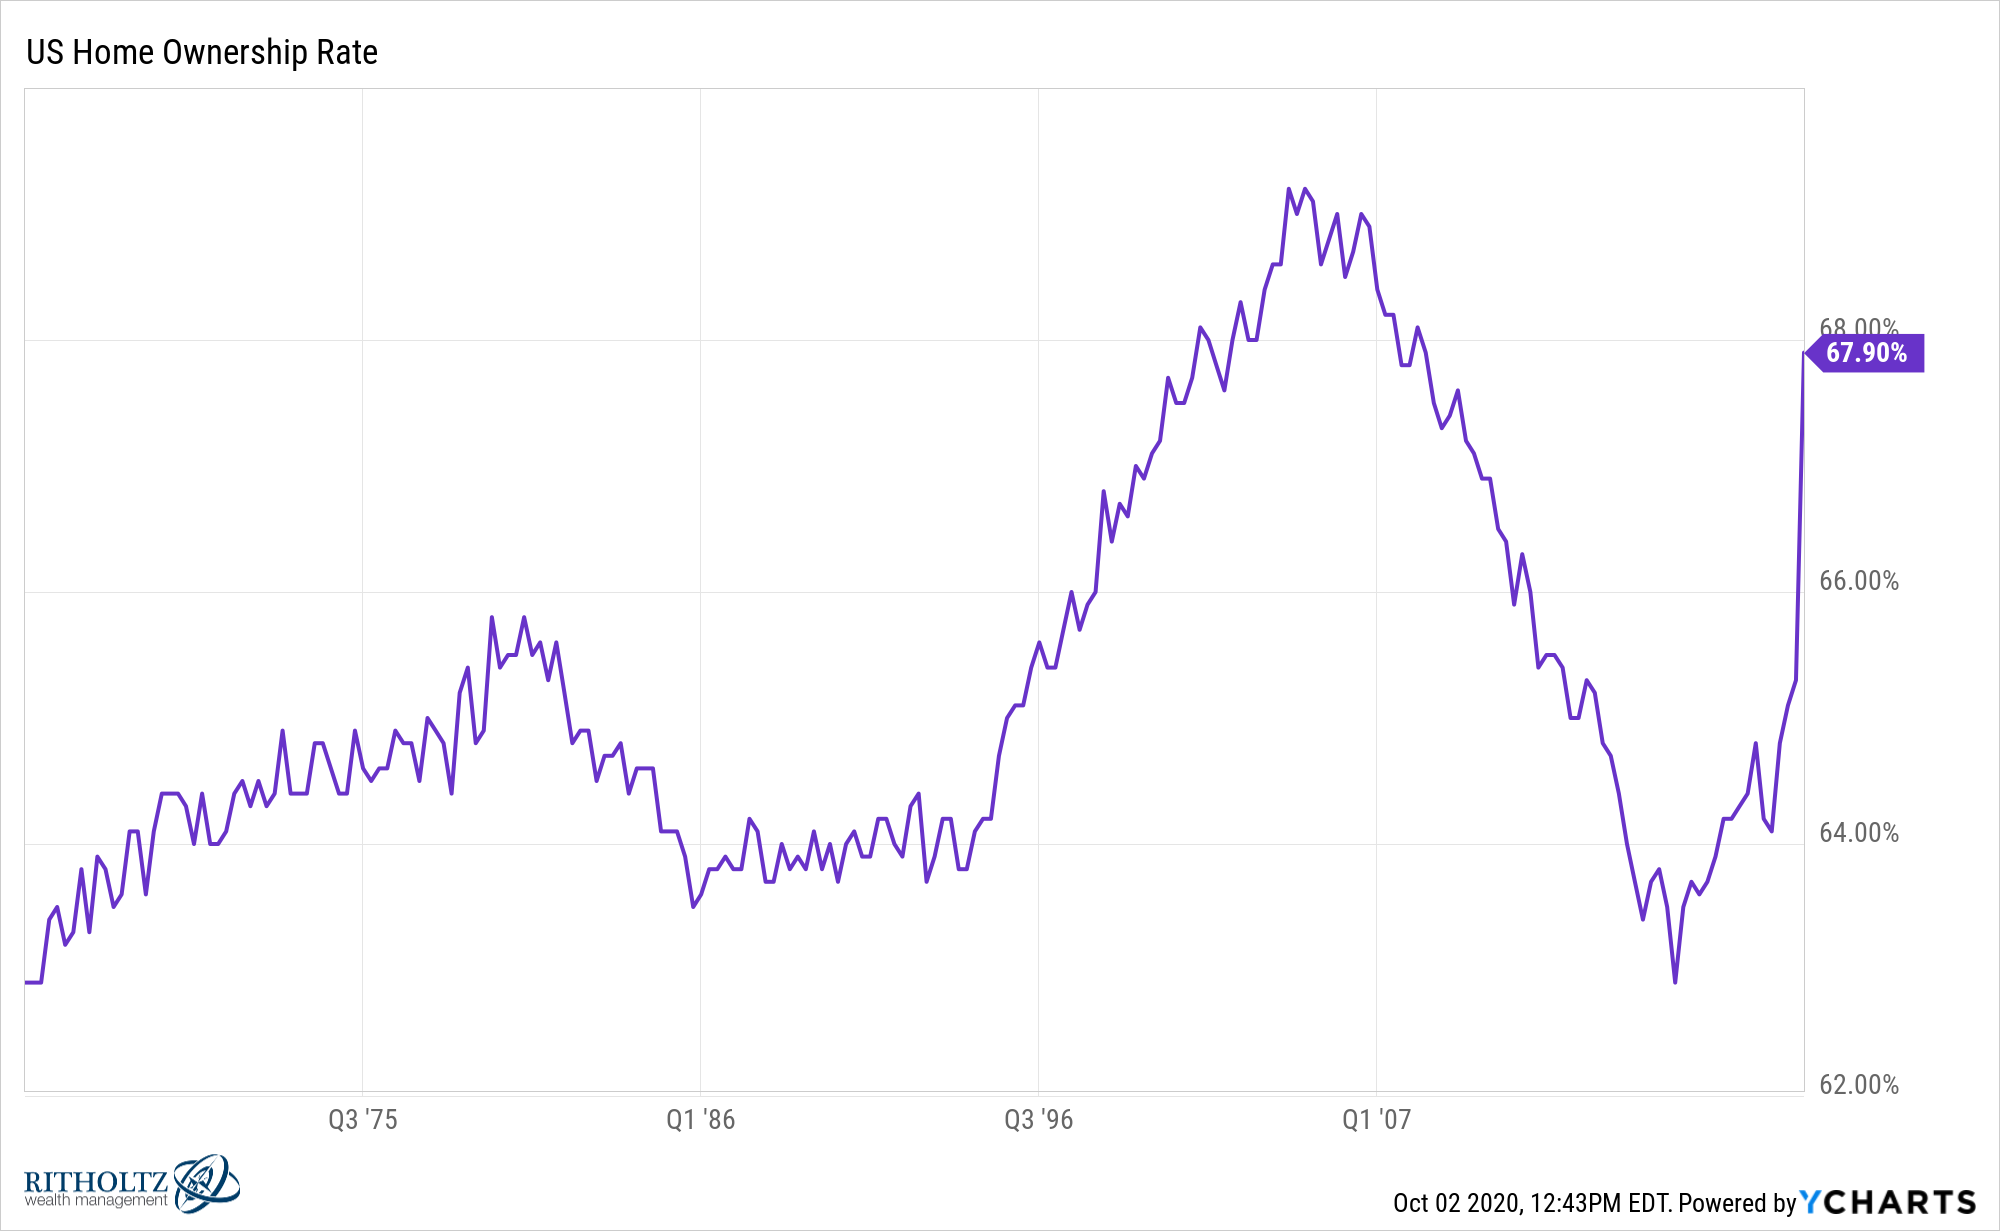
It doesn’t seem like housing supply is going to catch up to housing demand any time soon.
Further Reading:
Why Housing Could be One of the Best Performing Asset Classes of the 2020s
