They say that sentiment tends to follow price which is why when markets rallied following the presidential election it was immediately called the Trump Rally. I took a look at this rally in late-February to dissect how things changed at that time. Many of these assets have since lost their gains or new leadership has emerged to it may be time for an update but here’s what it looked like at that time when I wrote this for Bloomberg.
*******
As the election results began to come in on Nov. 8, many people were caught off guard. One such group was those trading stocks in the after-hours markets. U.S. stocks fell more than 5 percent in just a few hours late that evening as it became apparent that Donald Trump was going to defeat Hillary Clinton.
Experts and pundits predicted a stock market crash if Trump were to upset Clinton and win the presidential race, so the market’s behavior seemed to confirm expectations. But then a funny thing happened — stocks came roaring back, almost immediately. Markets opened slightly down but quickly regained those losses and finished the day with gains of more than 1 percent as investors digested what Trump’s proposed infrastructure and tax policies would mean for the markets.
Since then markets have been off to the races in what many have dubbed the “Trump rally.” No one can ever really know with any certainty what causes the markets to do what they do over the short-term, but there was definitely a sea change in investor preferences after the election results. You can get a better sense of how things have changed by looking at the performance of certain investments before and after Election Day in early November.
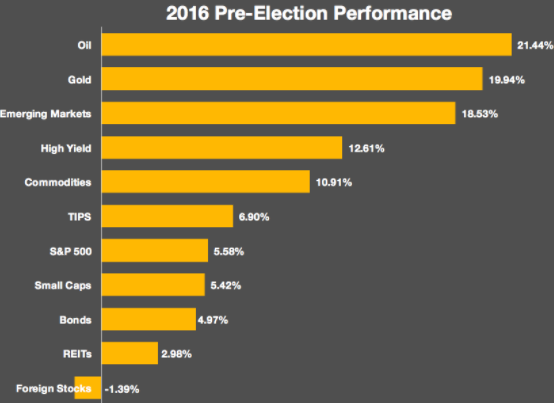
Here is a performance snapshot for a number of asset classes and real assets in 2016 pre-Election Day performance:
Now take a look at the performance of these same assets after the election and through this past Friday:
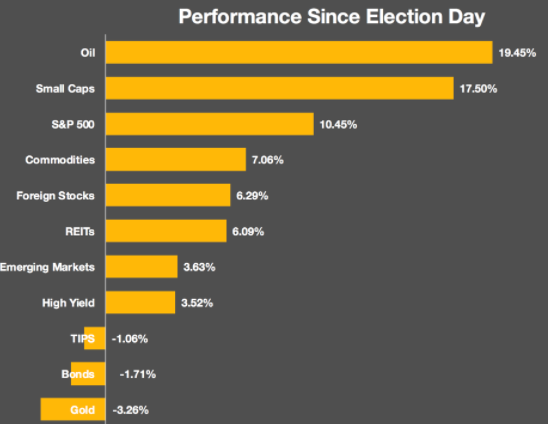
A few things stand out. First, oil has not been affected in the slightest by this change. It was rallying pre-Trump and has continued to rally post-Trump. But many of the other asset classes have had fairly large changes since Election Day. Gold rallied strongly in early 2016 but has slumped since Election Day. Small-cap stocks, typically a decent gauge of investor risk preferences, have rallied sharply since Trump’s win. Bonds have shown losses as interest rates have risen. Large-cap U.S. stocks have seen double-digit gains.
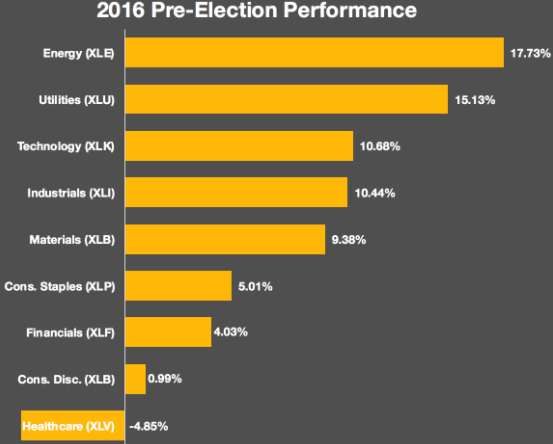
There have also been changes in sector performance. Here are the sector performance numbers for the S&P 500 in 2016 leading up to the election:
And here’s what’s happened since:
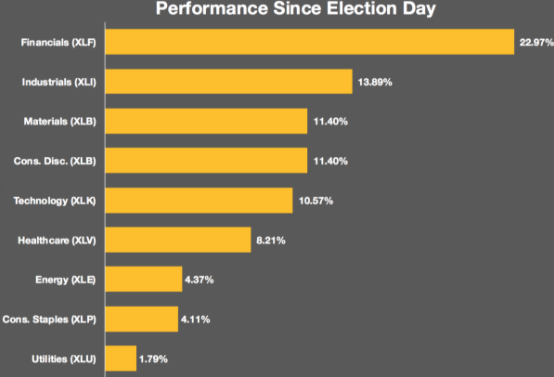
Many of the previous laggards are now the leaders and vice versa. Financial stocks have been the obvious sector winner as investors weigh what Trump’s policies will mean for Dodd-Frank and other financial regulations. The financials rally has been widespread as 16 of the 30 best-performing stocks on the S&P 500 have been financials. Five of those top 30 were industrials, meaning that more than two-thirds of the best names have come from just two sectors.
On an individual stock basis, Goldman Sachs and Bank of America have been huge beneficiaries since Trump won the election. In pre-election 2016 Goldman Sachs and Bank of America were struggling, up just 1.19 percent and 0.89 percent, respectively. Since Election Day, Goldman is up almost 40 percent and Bank of America is up more than 45 percent.
Health-care was the only sector to see negative returns leading up to the election. One of the reasons was the performance of biotech stocks. Many investors were worried about how Clinton’s health-care policies would affect these stocks, which caused them slide almost 25 percent in 2016 before Nov. 8. Since then, biotechs as a group are up more than 12 percent, helping out a nice rally in the sector overall.
The New York Times has been one of Trump’s biggest targets for criticism since the election but that hasn’t negatively affected its share price just yet. In fact, it’s done just the opposite. During 2016, in the run-up to the election, NYT stock struggled, down almost 17 percent. Since Trump was elected, however, NYT stock is up almost 40 percent.
So it seems the election of our new president has caused many changes in the markets over the past few months. There’s a lot going on under the surface in terms of the early winners and losers. But it’s far too early for investors in any area of the market to claim victory. Sometimes investors are simply looking for an excuse to make changes to their portfolios. Other times they’re far too hopeful and overreact to political changes. We’ll see if these changes hold or if markets have gotten too far ahead of themselves since the election.
Originally published on Bloomberg View in 2017. Reprinted with permission. The opinions expressed are those of the author.

