During the depths of the 2008 Great Financial Crisis, a friend asked for some stock-picking advice. It went something like this:
Friend: I’m thinking about taking a flier on GE. What do you think?
Me: I’m not good at giving advice about specific companies. It’s too hard, not my thing.
Friend: Here’s my thought process — all it has to do is get back to the pre-crisis highs of 2007 and I’ll make a ton of money.
Me: Well the stock is down close to 80% but there’s no guarantee it will come back to those levels.
Friend: I’m doing it.
Me: Godspeed.
Buying when there’s blood in the streets makes sense in theory but it depends which neighborhood those streets reside in. For the stock market as a whole, buying during a panic is likely one of the best strategies there is. The problem when trying to sift through the mess is some stocks don’t come back.
GE is one of those stocks.
Even if my friend bottom-ticked the stock market in early-March of 2009, he would be up just 27% on his GE shares1 during a period in which the S&P 500 has risen more than 500%. And he would still be waiting for the company to reach those pre-crisis levels because GE remains almost 80% off the prices from 2007.
General Electric was the biggest stock in the S&P 500 for the majority of the mid-1990s through the mid-2000s. As recently as 2010, it was the 5th largest company in the U.S. stock market.
At the peak of GE’s power the company boasted a market cap of nearly $600 billion:
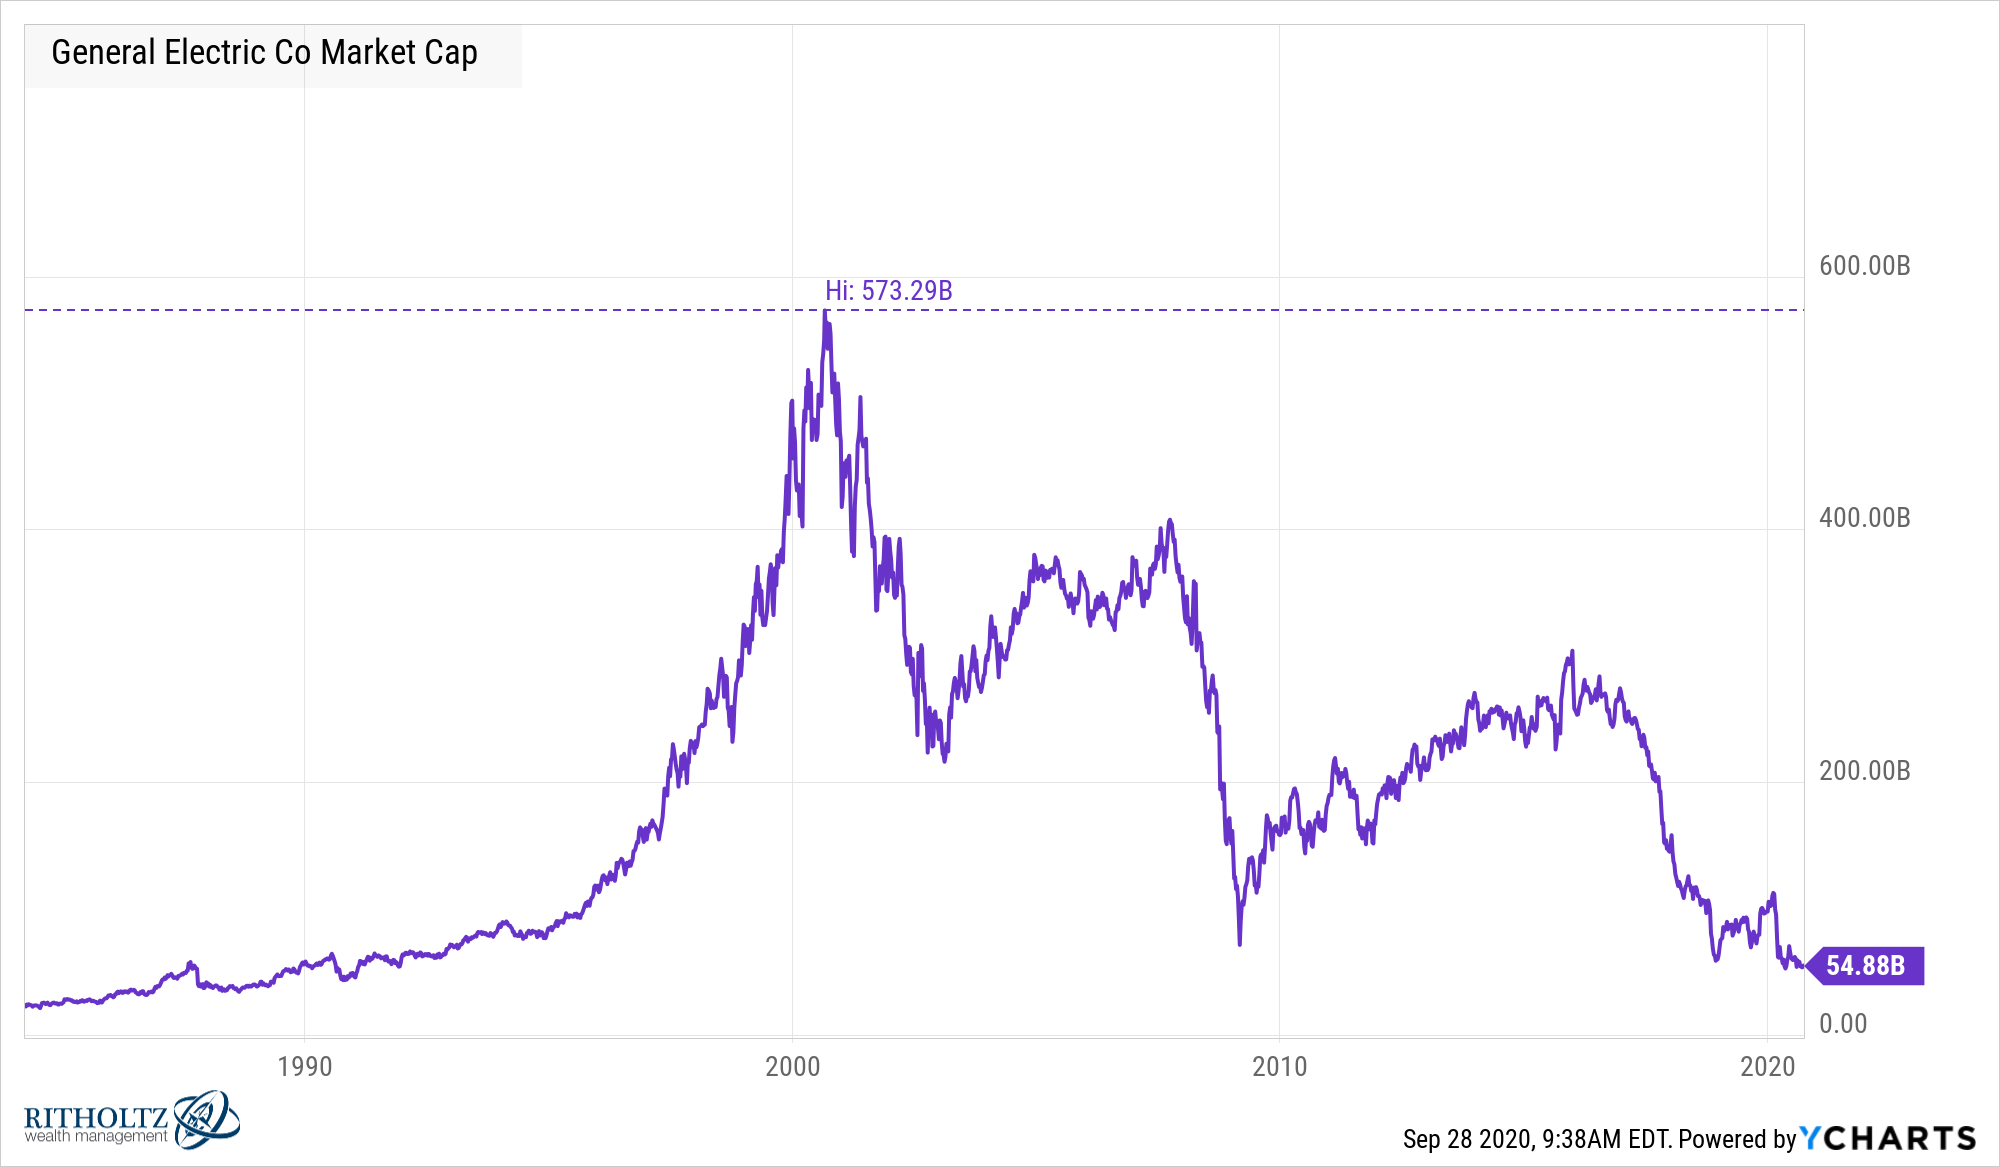
From that peak it’s now down more than 90%.
Granted, it’s still a $50+ billion company but the fall from grace here is spectacular.
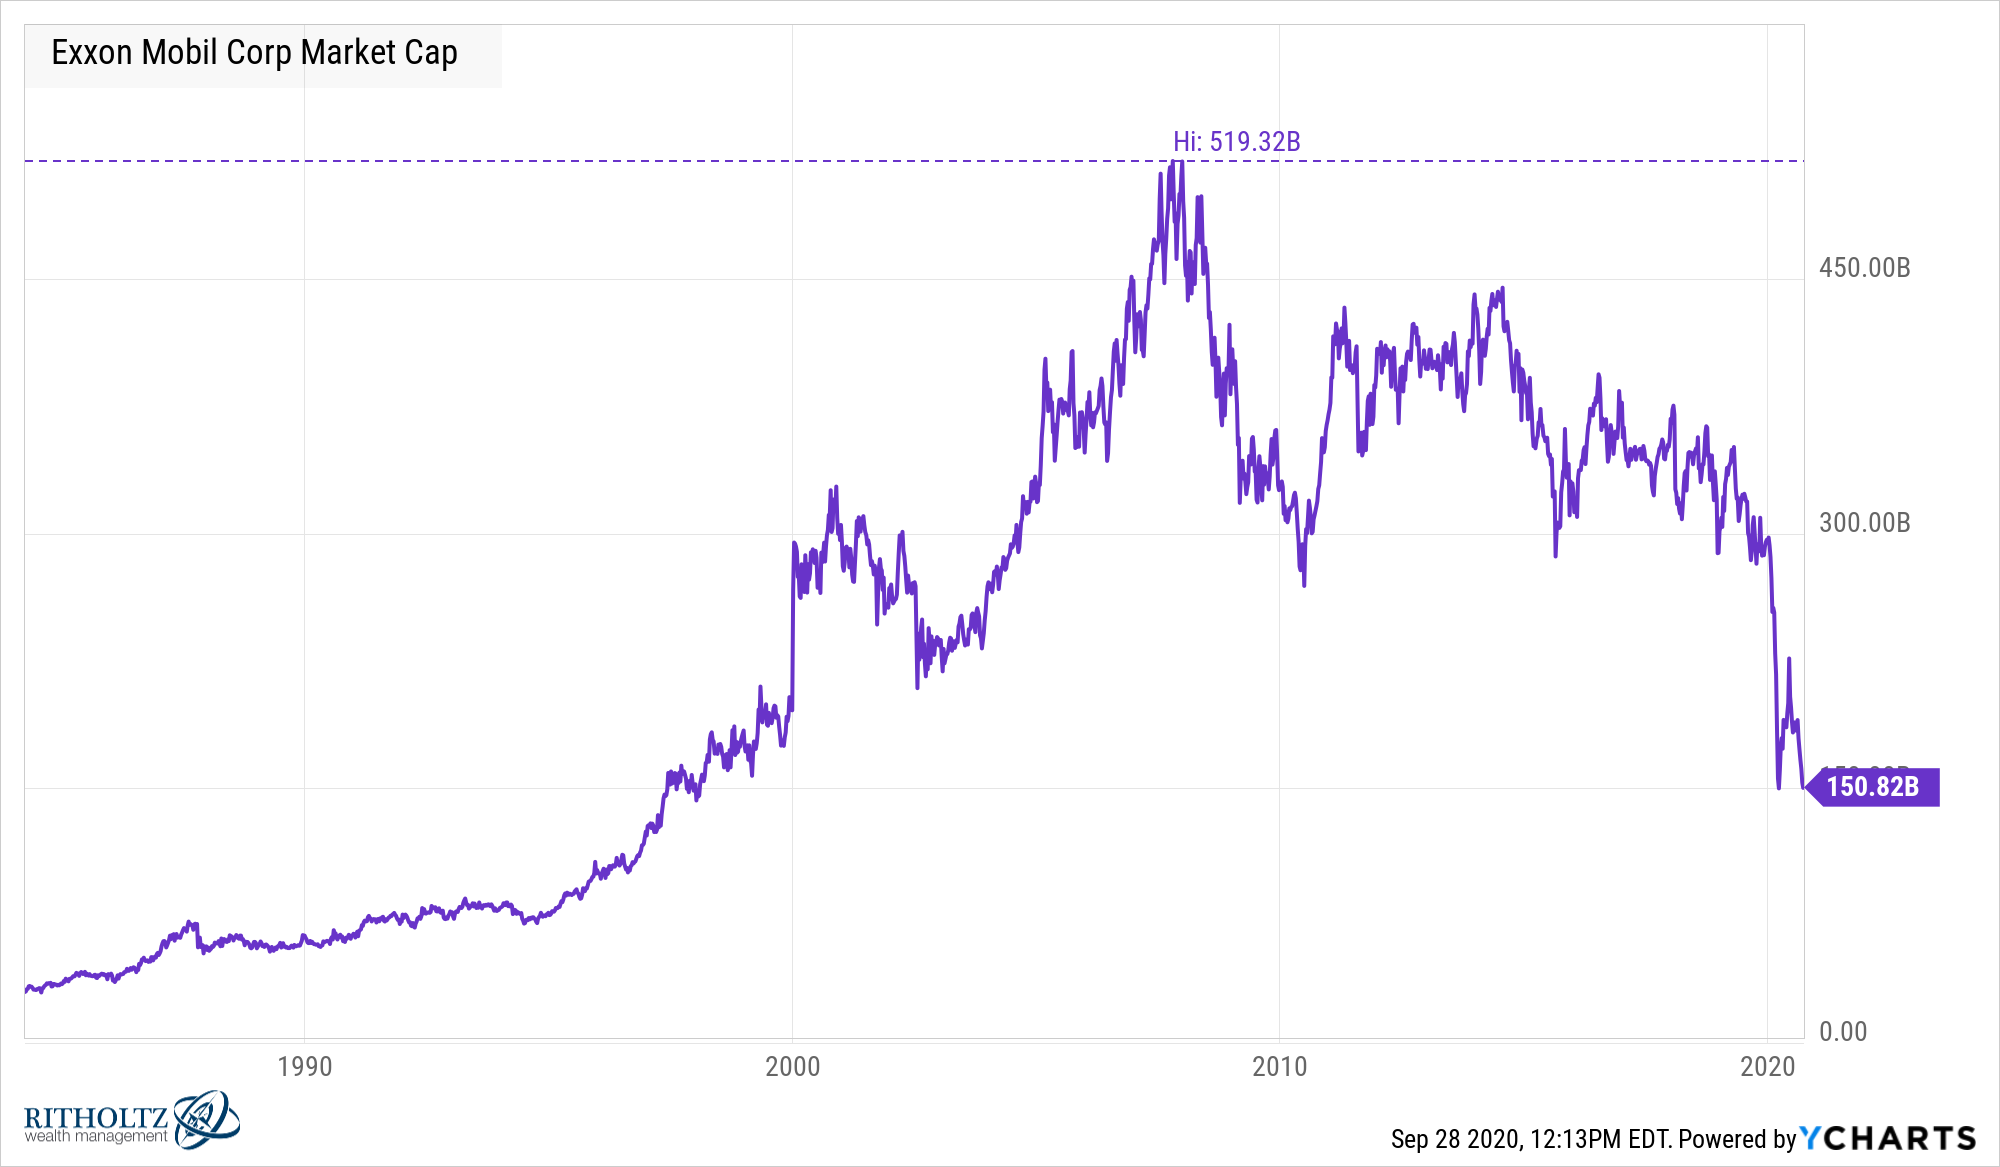
The company that took the baton from GE to become the largest in the United States was Exxon, which was the largest company in the U.S. stock market as recently as 2010. It’s possible Exxon is in the midst of its own spectacular fall from grace.
This stat from SentimenTrader is pretty wild:
Oof.
In the past 40 years, $XOM has never had a worse 30-day stretch. https://t.co/vZSKEevIB5 pic.twitter.com/DkePGuIBrP
— SentimenTrader (@sentimentrader) September 25, 2020
Since holding top honors in 2010, Exxon has been cut in half.
From its peak in 2007, Exxon’s market cap is down more than 70%. Since 2014 alone, investors have lost nearly 60% and that includes dividends.
At roughly $150 billion, Exxon is still the 40th largest name in the S&P 500 by market cap. But that’s a far cry from the $519 billion the company was worth in 2007 when the energy markets were rocking.
I don’t know for sure if Exxon is the next GE. Maybe the energy sector sees a resurgence. Maybe oil prices spike. Maybe electric vehicles take longer to take over the car market than people think.
But history is littered with huge corporations that get to the top of the mountain yet never come close to reaching those levels again.
Citigroup, Bank of America and AIG were all in the top 10 in 2005. Those stocks are down 90%, 42% and 97%, respectively since the end of that year.
Sears was one of the 10 biggest stocks for much of the 1980s. They filed for bankruptcy in 2018.
In fact, since 1980 the turnover rate for the top 10 companies in the S&P 500 is 50% if you look at that list every 5 years. So every 5 years, half of the names in the top 10 are new.
It’s always more fun talking about the biggest winners over time but it’s worth remembering many of those winners eventually become the biggest losers.
Some stocks don’t come back.
Further Reading:
Nothing Fails Quite Like Success in the Stock Market
1And all of these returns came from dividends alone. The price right now is basically right where it was at the lows in 2009.

