With the stock market charging back to all-time highs in record time from the pandemic bear market there is a growing chorus of “the stock market is detached from economic reality” takes.
I get it.
The stock market rocking again in the face of double-digit unemployment and massive pain for many small businesses doesn’t feel right.
Economic reality eventually matters for the stock market over the long-term but it makes sense that it can become detached over the short-to-intermediate-term.
By one researcher’s estimate, there are close to 600,000 companies in the United States that employ 20 or more people. Just 3,600 or so of those businesses are publicly traded.
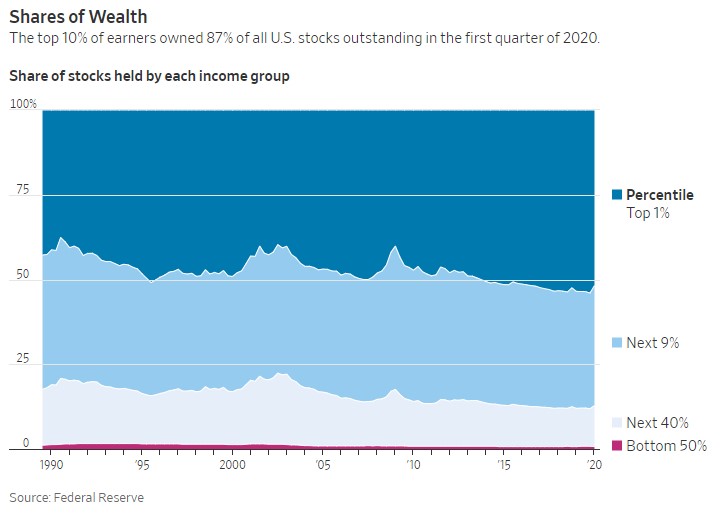
The stock market represents less than 1% of businesses in America. It just so happens that 1% includes some of the biggest, most powerful companies on the planet. One of the reasons people are now so angry at the stock market is because it’s concentrated in the hands of so few (chart via the WSJ):

The bottom 50% own less than 1% of the stock market while the top 1% owns 54% of stocks.
If more people participated in the stock market, there wouldn’t be so much displeasure directed at its rise.
Of course, there is a reason only half the population owns shares in corporate America — most people can’t afford to save.
Being in the middle class fifty or sixty years ago meant you could afford a decent house and car on a single income household and probably retire with a decent pension. That’s just not the case for most people anymore. And the middle class itself is much smaller than it was in those days.
This is both good and bad depending on where you fall in terms of the wealth classes.
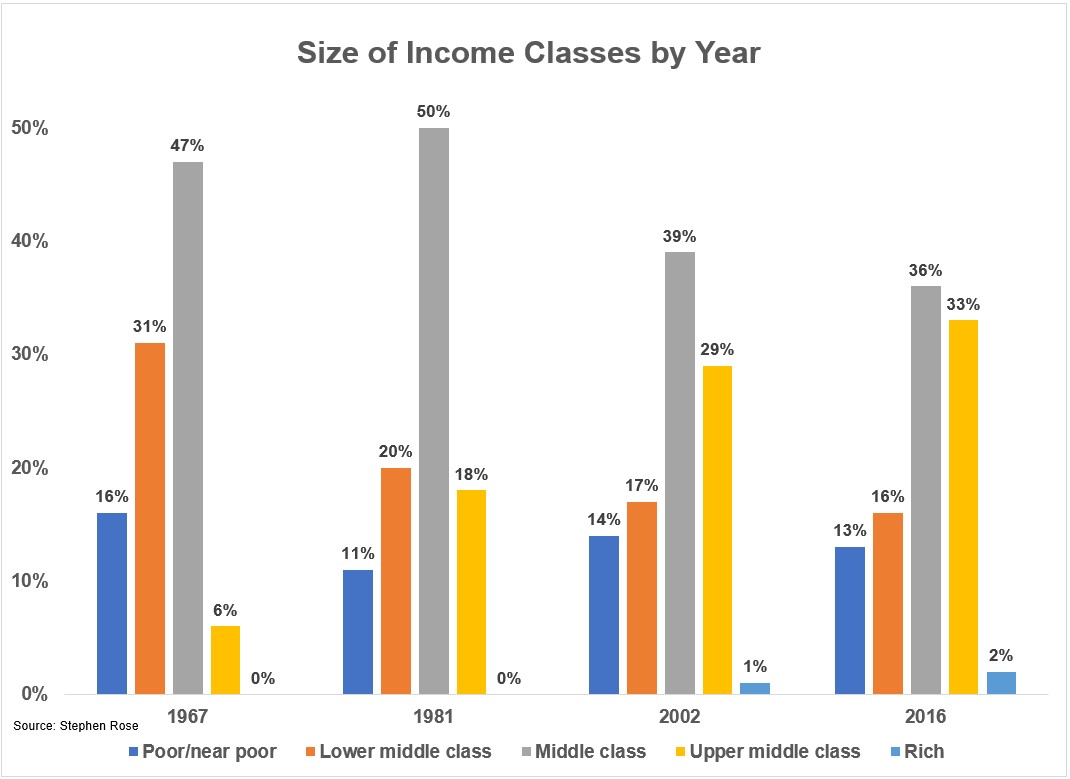
Stephen Rose just put out a new report entitled Squeezing the middle class: Income trajectories from 1967 to 2016 that looks at how the wealth classes* in this country have changed over time:

The upper middle class tripled in size from 1967 to 1981 and then nearly doubled from 1981 to 2016. The gains in the upper middle class have come from the middle class, which has shrunk from 50% in 1980 to 36% by 2016. The lower middle class was cut in half from 1967 to 2016 while the poorest class basically stayed the same. And the richest class, although the smallest, also saw substantial growth.
This is actually good news. We’ve done a wonderful job as a nation in pulling people out of the middle class and moving them up in the world but not a great job in pulling people up from the lower income levels.
The relative growth rates in earnings also show how uneven the changes have been over time. Income growth at the top of the distribution has been almost twice as fast as it’s been in the middle. So people earning the most are also seeing their incomes rise at faster levels than everyone else.
Obviously, it’s not always the same households in each category over time. People can and do move up or down the income rungs. Rose points out that the tails can see some massive movements between income levels from both positive and negative surprises. One-third of the people in both the top and bottom income classes are only there temporarily because of an unexpected event.
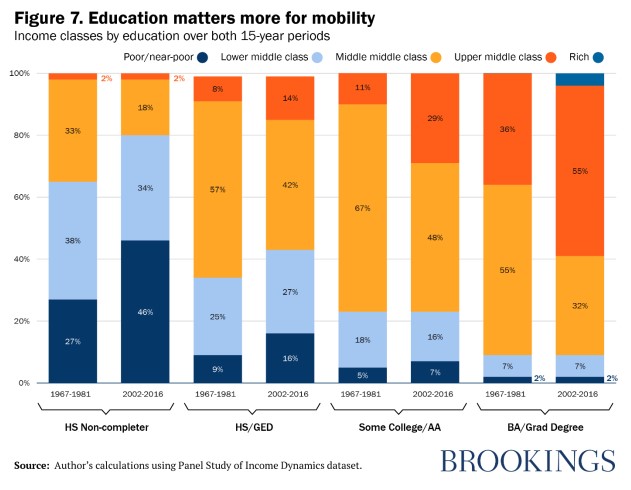
The biggest winners over the past few decades have been the college-educated upper middle class:

If you want to know why there is a student loan crisis in this country look no further than this chart. You can say all the bad things you want about how messed up our higher education system is but in terms of moving people up in the world it has done wonders.
Many people mourn the fact that the middle class is shrinking in this country. But the reality is this shrinkage has been a good thing for many people — they’ve moved into the upper middle class.
The pandemic is going to make inequality worse on many levels and likely supercharge the differences between the top and bottom of the income classes. The next step in our evolution as a country should be to figure out a way to better serve the poor and lower middle class.
Further Reading:
World War II: The Economic Anomaly
*Rose defined the various classes in terms of household income as follows (in 2018 dollars):
- Poor and Near Poor: Less than $32,500
- Lower middle class: $32,500 to $54,500
- Middle class: $54,500 to $108,500
- Upper middle class: $108,500 to $380,500
- Rich: >$380,500
