“How much do I need to save for retirement?” is one of the harder questions to answer in all of finance because so much of it depends on your lifestyle, spending habits, lifespan, debt profile, risk appetite, financial market returns, life events and so on.
William Bernstein offers up a decent approximation in his book Rational Expectations called the liability matching portfolio (LMP). The LMP is simply the amount of money necessary to cover a retiree’s basic living expenses in the future. Bernstein uses 25 years of living expenses in savings as an example of a target LMP.1
Market returns are far from stable over time so Bernstein looked at a simple example to show how much luck is involved in the retirement planning process to create that LMP for different generations:
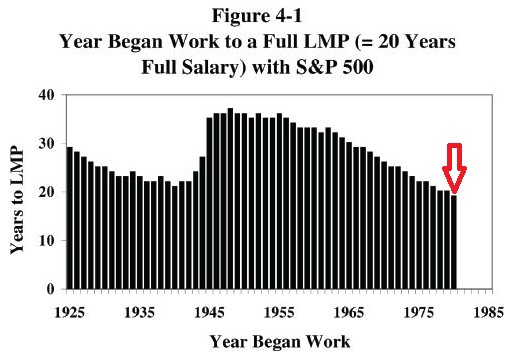
This chart shows how long it would have taken someone saving 20% of their income and investing it in the S&P 500 to accumulate 25 years of living expenses in their LMP for retirement.
I highlighted the lowest number of years to reach the threshold which was 1980, where it would have taken someone investing 20% of their income in the S&P 500 just 19 years to hit their LMP.2
On the other hand, someone starting out in the late-1940s would have taken closer to 40 years to hit that mark.
From 1980 through 1999 the U.S. stock market was up nearly 18% per year or almost 2,600% in total. The U.S. aggregate bond market was up 10% per year or nearly 600% in total.
It just so happened baby boomers were extremely lucky to hit their peak earning (and therefore saving) years in the early-1980s when stock market valuations were depressed and interest rates were double digits. They could also buy relatively affordable homes and weren’t saddled with tens of thousands of dollars in student debt when they hit the job market.
And the 1980s and 1990s were two of the calmest decades on record in terms of economic crises and stock market crashes.
Millennials haven’t been so lucky.
My generation has now experienced two of the worst economic crises of the past 100 years in the span of less than a decade and a half.
Lee Clifford at Fortune compiled wealth statistics from the Federal Reserve which shows how this has impacted each generation:
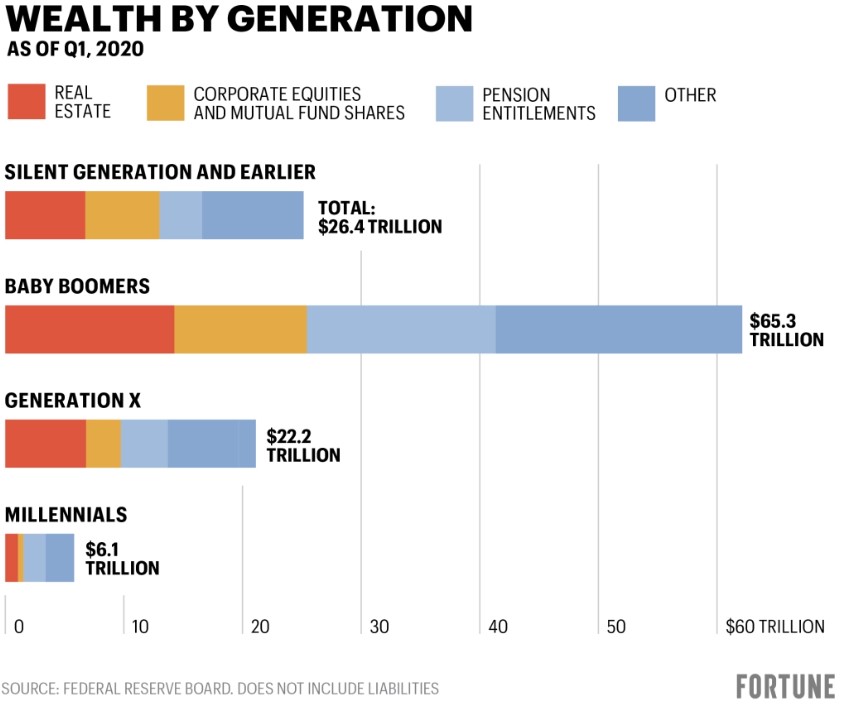
Here is another breakdown by real estate wealth:
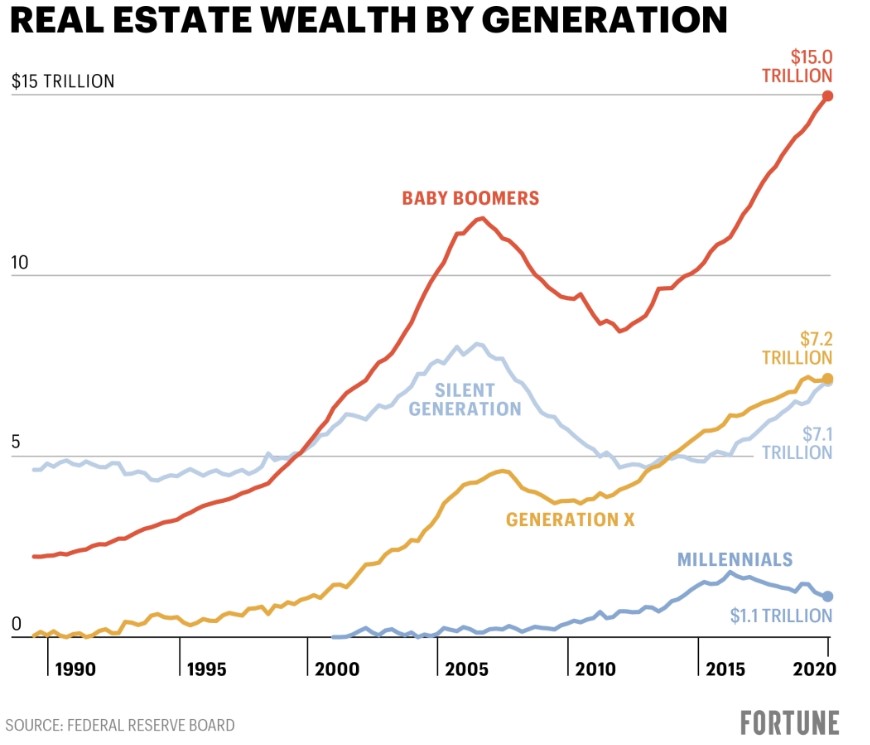
You can see real estate assets have actually been falling for millennials over the past few years even though the housing market has remained strong.
Goldman Sachs performed a similar breakdown for ownership of the U.S. stock market by generation:
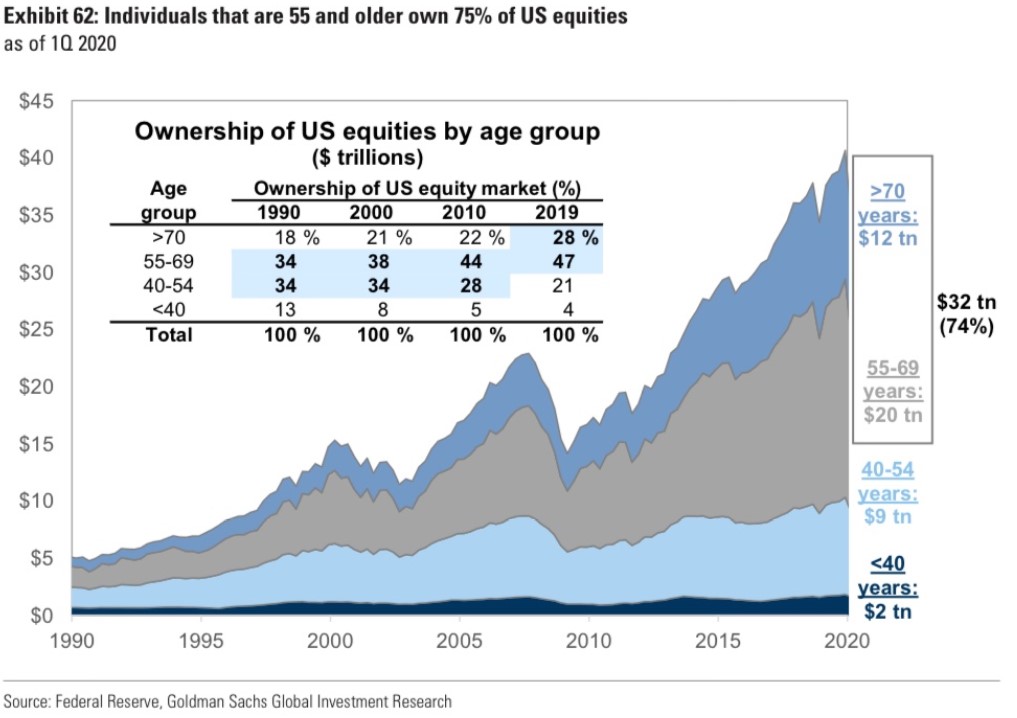
Not only do the baby boomers own more equity than millennials, but their relative advantage has also been growing over time for both stocks and real estate. You can see how this relative wealth gap has changed over the past three decades:
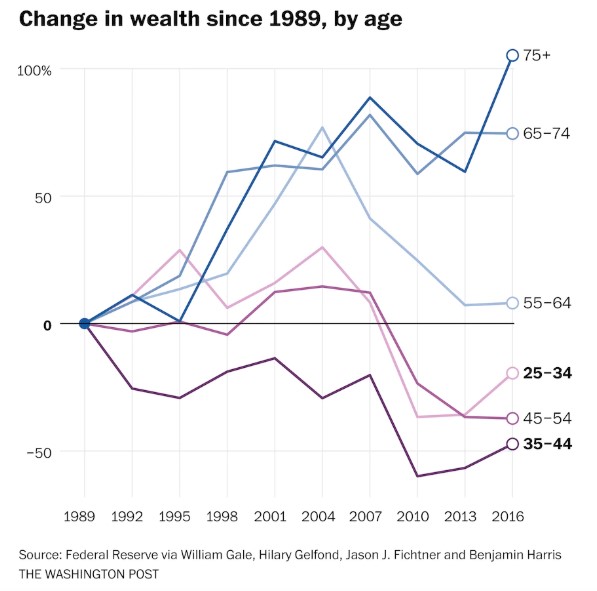
It makes sense that older folks would hold more assets than young people because they’ve had more time to accumulate capital. But the relative changes here are demoralizing. Wealth inequality has been a topic of conversation for years now but this has manifested itself not just by wealth strata but by age.
Andrew Van Dam at the Washington Post put together a chart of real GDP during each generation’s first 15 years in the workforce at age 18 going back to the 1800s:
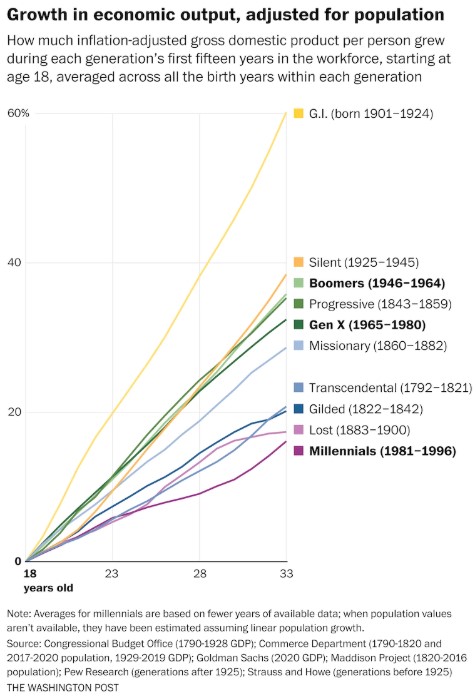
Millennials have seen the slowest growth of any generation dating back to the James Monroe administration.
Now I’m not a huge fan of victim culture that puts all of the blame for your situation on other people. But it is worth noting how much of your place in the world comes from luck. Where and when you were born has so much more bearing on financial and career outcomes than most successful people are willing to admit.
I still have hope for millennials. We are the biggest demographic in the country right now. Baby boomers will not rule forever.
But young people have a right to feel a little angry about how things have worked out over the past couple of decades.
Further Reading:
Why Is There a Retirement Crisis?
1Which makes sense from the perspective of the 4% rule.
2Where were all of the baby boomer FIRE people?
