The New York Times ran a story recently that shows long-term bonds beat the pants off the stock market over the past 20 years or so. These annual performance numbers are from the start of the century in 2000 through the end of April 2020:
-
The S&P 500: 5.4 percent.
-
Long Treasury bonds (with a duration of at least 10 years): 8.3 percent.
-
Long investment-grade corporate bonds: 7.7 percent.
-
Junk bonds: 6.5 percent.
-
Broad investment-grade bond index (the Bloomberg Barclays US Aggregate Bond index): 5.2 percent.
I looked at the numbers myself just to be sure. Here are the total returns for this period:
-
The S&P 500: 194%
-
Long Treasury bonds (with a duration of at least 10 years): 428%
-
Long investment-grade corporate bonds: 405%
-
Junk bonds: 263%
-
Broad investment-grade bond index (the Bloomberg Barclays US Aggregate Bond index): 180%
Long maturity and junk bonds walloped the stock market while the broader aggregate bond index more or less kept up with equities.
So what’s going on here?
There are a few simple explanations.
The first is the start date of this time frame coincides with the highest valuations in the history of the U.S. stock market. Late-1999/early-2000 was the worst entry point in U.S. stock market history.
And long-term government bond yields were over 6.5% at that time. When you combine high starting yields with falling interest rates and a high duration fixed income asset, you get pretty good returns in bond land.
Just because I like to have fun with numbers, if you just move the start date forward a couple of years, the bond advantage is easily erased. The iShares 20+ Year Treasury Bond ETF (TLT) dates back to early-2002. If we begin our performance journey from June 2002 the relative performance looks much different:
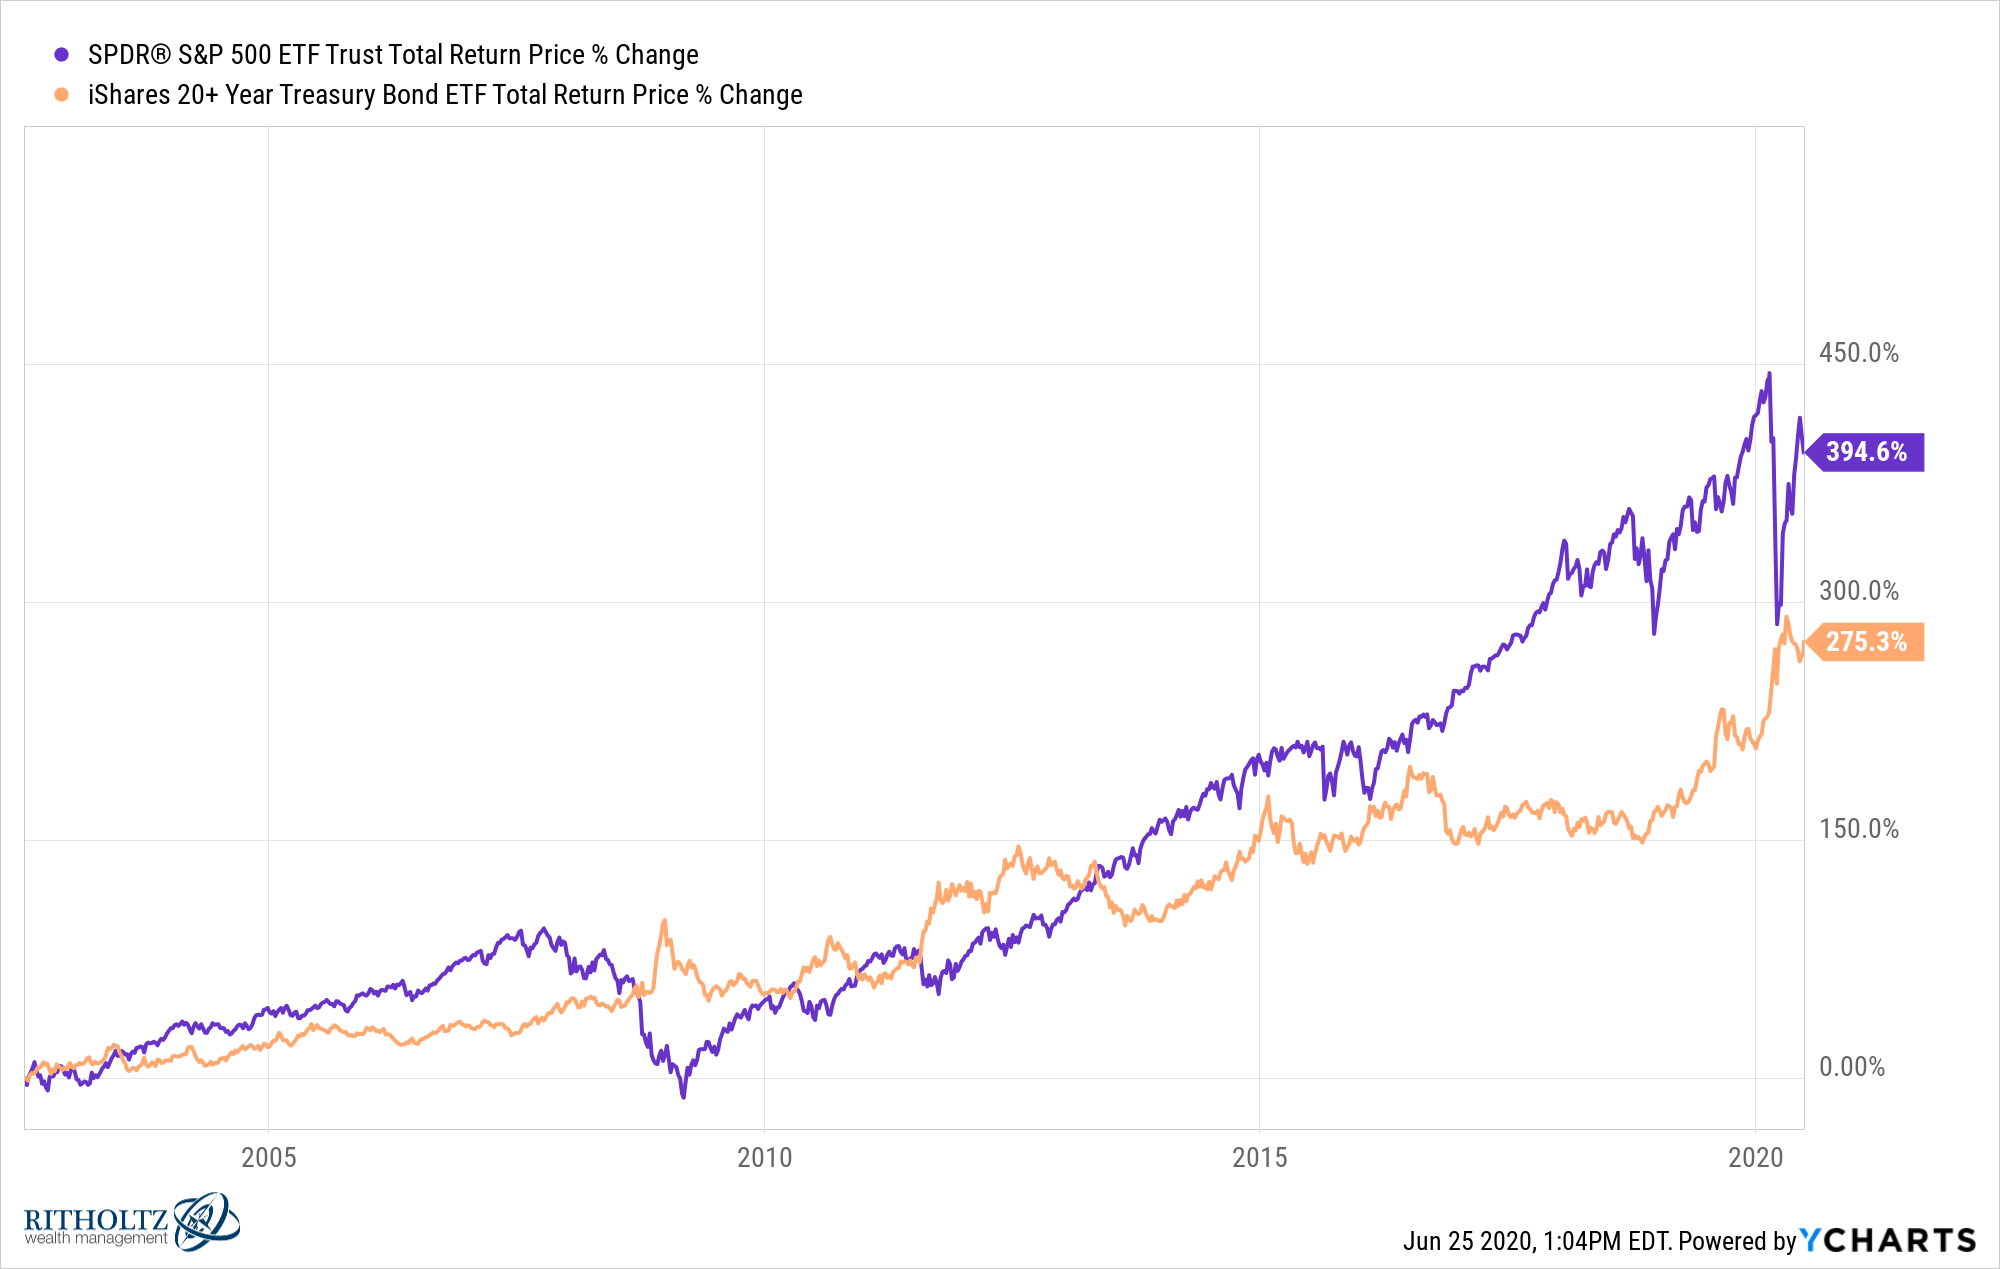
Now stocks look to have crushed long-term bonds.
Neither start date is necessarily right or wrong, it’s just that one begins near the top of an all-time bubble while the other is closer to the lows of the aftermath of that bubble bursting.
Markets tell different stories depending on the time frame selected.
It’s also true that bonds sometimes beat stocks, even over longer periods of time, textbooks be damned.
I looked at the rolling monthly total returns for various time frames for the S&P 500 and long-term treasuries going back to 1926:
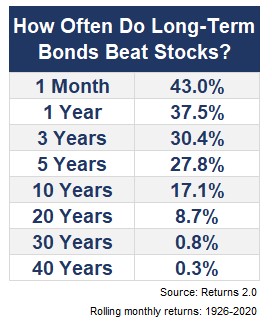
You can see it’s not out of the ordinary for long-term government bonds to beat stocks. It’s not a high probability event over 10, 20, 30 or 40-year time frames but it does happen.1
Stocks have outperformed roughly 9 out of every 10 rolling 20-year periods going back more than 90 years of market history. It just so happens that one of those 20-year periods happened this century.
So it goes.
If the stock market always won over every time frame there would be no risk involved. If there was no risk involved there would be no risk premium.
The reward for owning stocks over the long haul comes from the fact that they sometimes underperform for an extended period of time and rip your face off in the short-term with bone-crushing losses.
And it’s not just long-term bonds that can outperform stocks. Here are those same numbers for cash (one-month t-bills) versus the S&P 500:
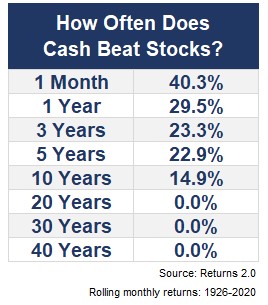
Cash has never beat the S&P 500 over 20, 30 or 40-year windows but stocks have underperformed cash in almost 15% of all 10-year periods. This is the maddening nature of risk.
Some people look at these numbers and assume it disproves the idea that stocks are good long-term investments.
On the contrary, this only proves the benefits of diversification. Diversification protects you from periods of poor performance by any given asset class.
Stocks are still your best bet over the long-term but not every long-term.
The stock market wouldn’t offer such wonderful long-term returns if you didn’t hate yourself for owning them at least some of the time.
Further Reading:
An Appreciation For the Bull Market in Long-Term Bonds
1There were 2 rolling 40-year returns where long-term bonds beat stocks and both occurred near the bottom of the market in early 2009. At the end of February 2009 bonds held a slight advantage in terms of annual returns — 8.63% to 8.57%. At the end of March 2009, it was bonds 8.79% and stocks 8.71% for the preceding 40-year annual returns. So bonds beat stocks but it was a tiny advantage that was over in the blink of an eye.
