From 1982 through September of 1987, the S&P 500 rose 236% or nearly 24% annually. The index was up more than 50% on a total return basis from the start of 1987 through the end of September of the same year.
You know what happened next. The biggest one day crash in history saw stocks fall more than 20% in a single day. Many people at the time worried the crash would lead to depression. I don’t blame them.
Yet on a long-term chart the 1987 crash looks like a minor bump in the road:
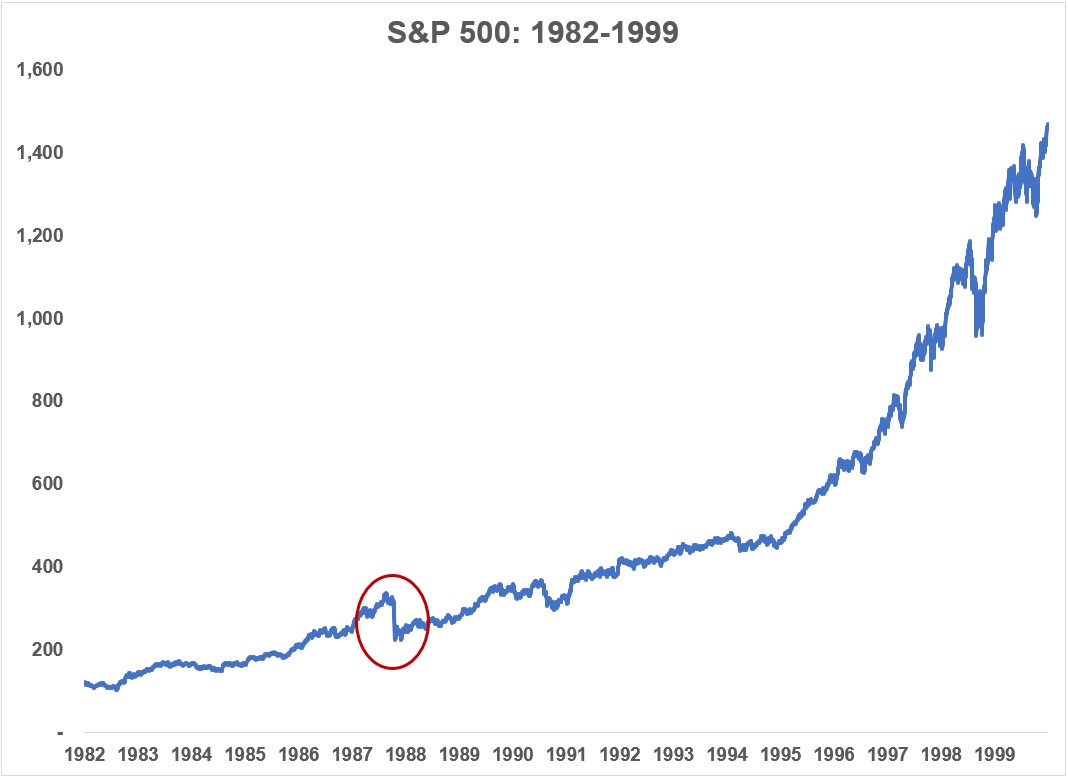
The S&P 500 managed to finish the year up more than 5%. From October 1987 through the end of 1999, the stock market would rise an additional 533% or 16.3% on an annualized basis.
Investors are often fond of using past market environments to compare to the current state of affairs, typically referencing those comparisons with, “history doesn’t repeat but it often rhymes.”
From March 2009 through January of 2020, the S&P 500 was up more than 450% or 16.9% annually. Then the Coronavirus hit and stocks got slaughtered. But look at how quickly they’ve come back:
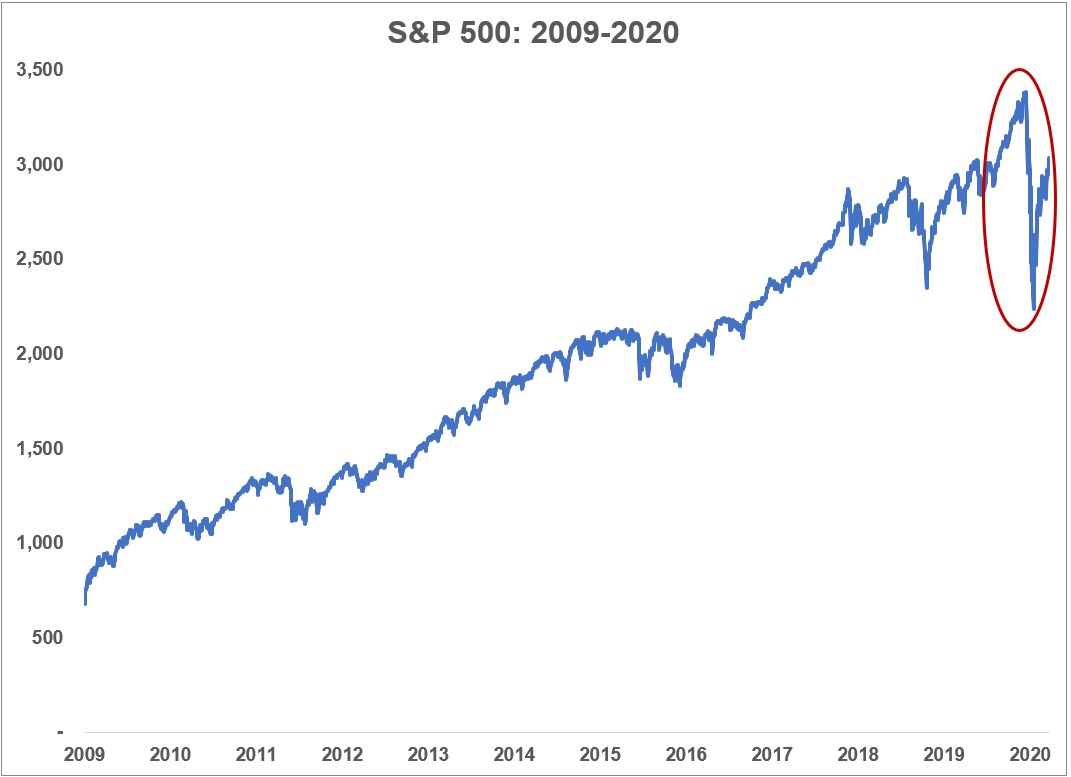
When I looked at the crash and subsequent rally earlier this week I thought to myself: Why couldn’t this be a 1987 moment where we see an awful crash followed by a resumption of the bull market?
My next thought was this:

Nothing about this environment is like the 1980s. They may have thought they were going into a depression back then but we actually did this time (and still stock market is still rallying!).
One of the reasons history doesn’t repeat or rhyme is because there is always stuff happening that has never happened before.
Just look at what’s transpired in the markets this year.
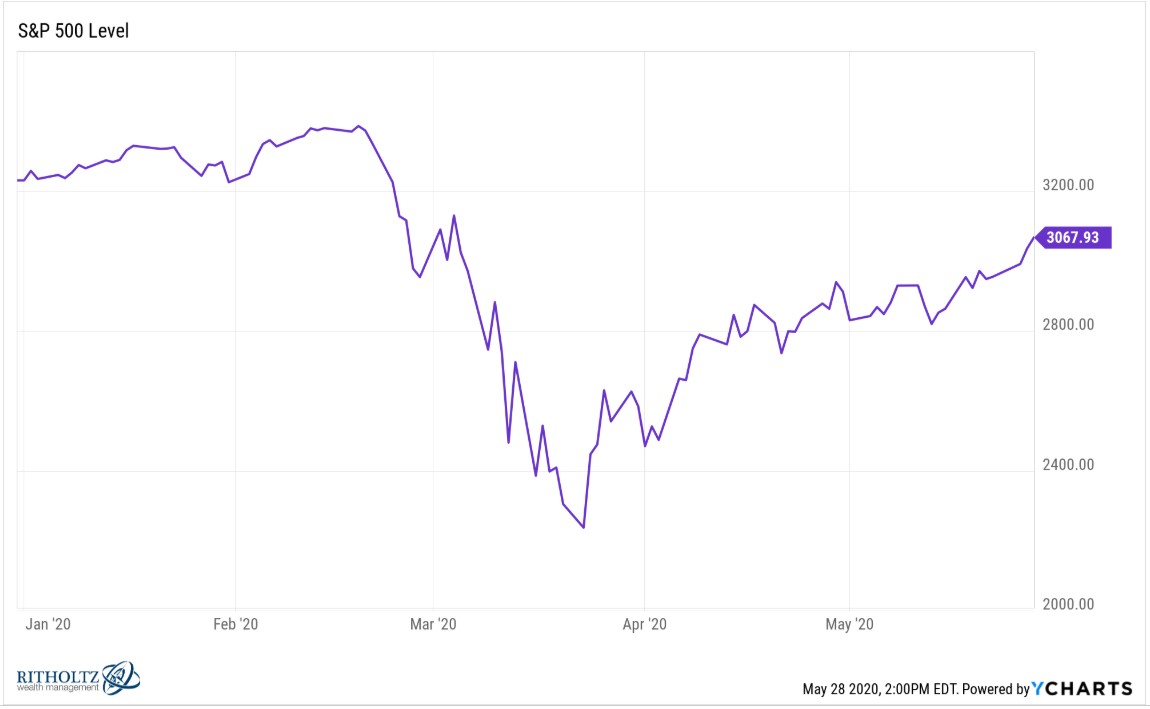
It took just 22 trading days for the S&P 500 to fall 30%, the fastest 30% decline ever from an all-time high.
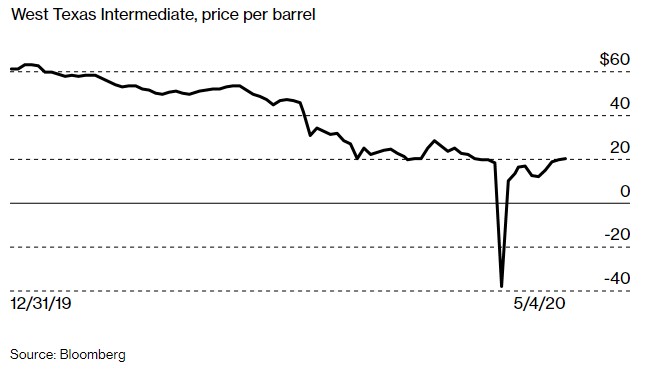
Oil prices went negative.
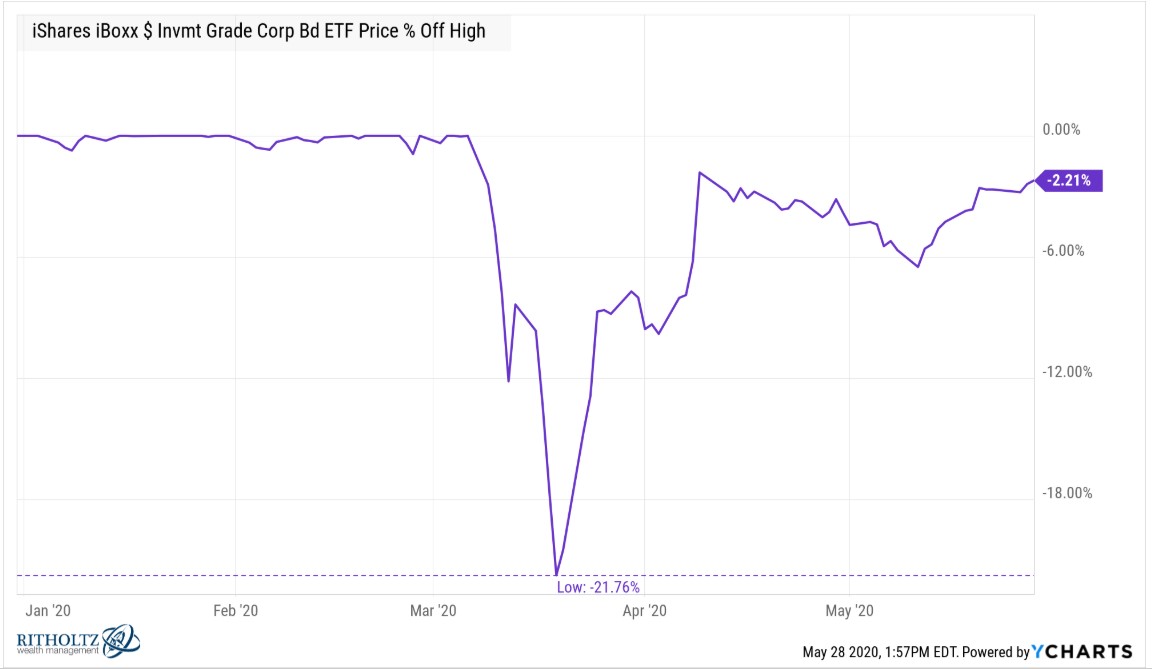
Corporate bonds fell 22% before the Fed stepped in with their bazooka.
Not only that but even treasuries sold off in mid-March as investors made a mad dash for cash:
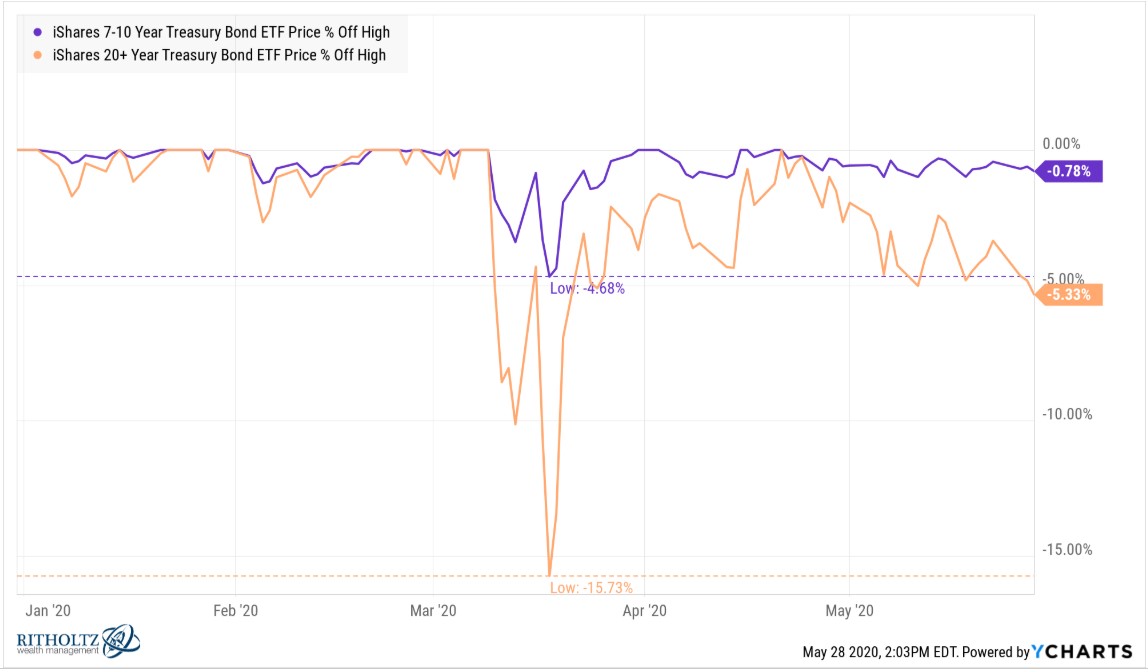
Some of the biggest bond ETFs even traded at a discount for a few days during the massive selling of risk assets.
We’ve gone from the Great Depression to the 1990s in the span of two months.
There have now been 25 (and counting) daily move of 3% or more for the S&P 500.
March was possibly the most volatile month ever in the stock market.
Something investors like to remind you of during bear markets is how “The stock market never bottoms on big up days.”
This makes sense when you consider big up days and big down days tend to cluster around one another during market downtrends. Volatility typically goes haywire in both directions when stocks are falling because investors panic sell and buy.
As of the close on March 23rd the S&P 500 had fallen 34% peak-to-trough. The very next day stocks were up 9.4%. The previous month had seen daily gains of 6%, 9%, 5%, 4% and 5% so you could excuse investors for not believing that huge one-day bounce was going to be the bottom.
Guess what?
That enormous 9.4% bounce was THE bottom (so far).
The same thing happened in late-2018. On Christmas Eve that year the S&P 500 was up 5% after falling close to 20%. That 5% up day proved to be the bottom.
Stuff that “never” happens in the markets seems to happen all the time now.
I figured the fall of 2008 was going to be the craziest market environment of my lifetime. The last 3 or 4 months has surpassed that and then some.
Make no mistake — this is a one-of-a-kind market and anyone who tells you they know what’s coming next is nuts.
Further Reading:
What Good is History When Dealing With an Unprecedented Crisis?

