Making economic or market comparisons to the Great Depression is almost always ridiculous…until now that is.
The daily price swings we’ve seen in the last month were beginning to rival what happened during the 1929-1932 period. The worst 10 daily returns since the late-1920s are dominated by the Great Depression, 1987, the Great Financial Crisis and this month:
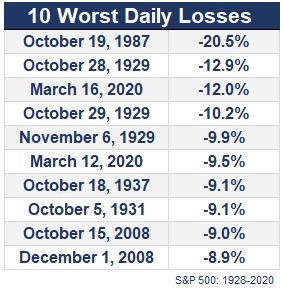
Two out of the 6 worst days ever have come in the past couple of weeks. Being on the same table as 1987 and 1929 data is typically not a good thing.
Michael shared this chart last week:
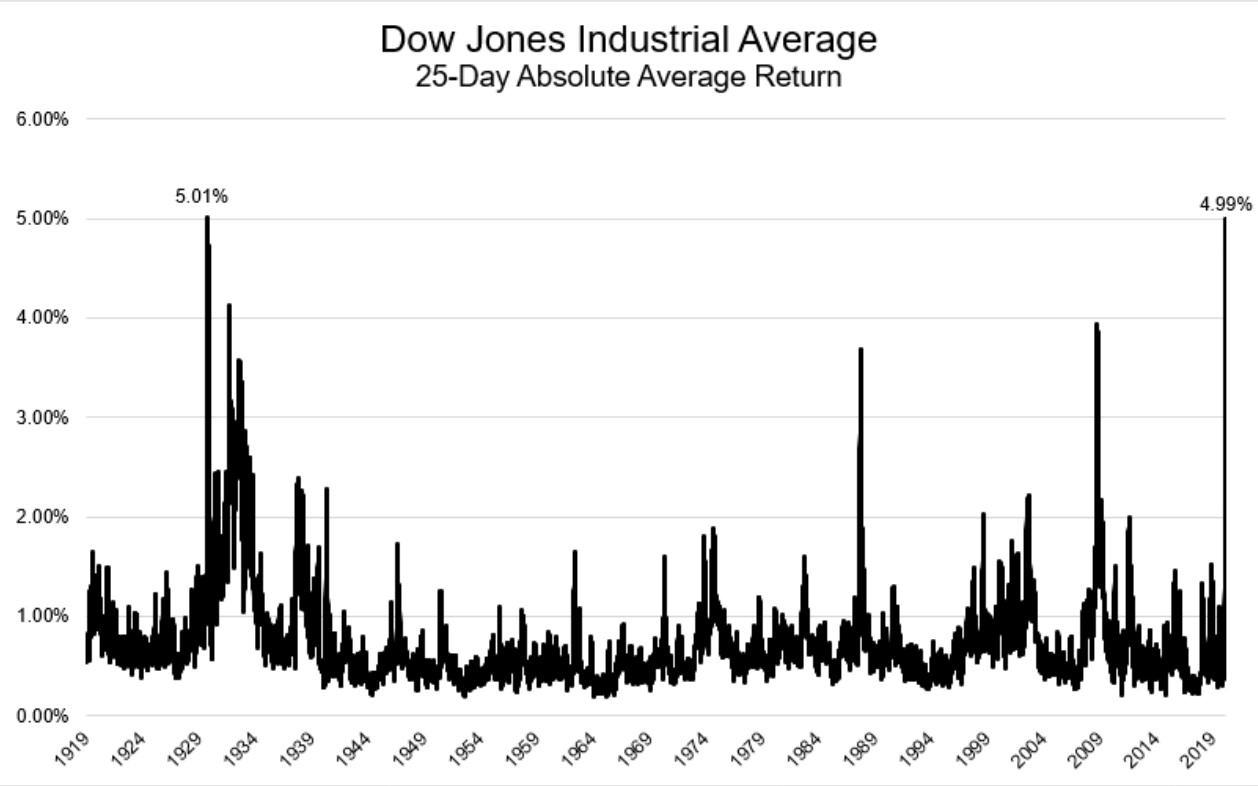
The levels of volatility over the past month are worse than anything markets saw in 2008 or 1987 and are on the doorstep of Great Depression levels. Things have been that crazy.
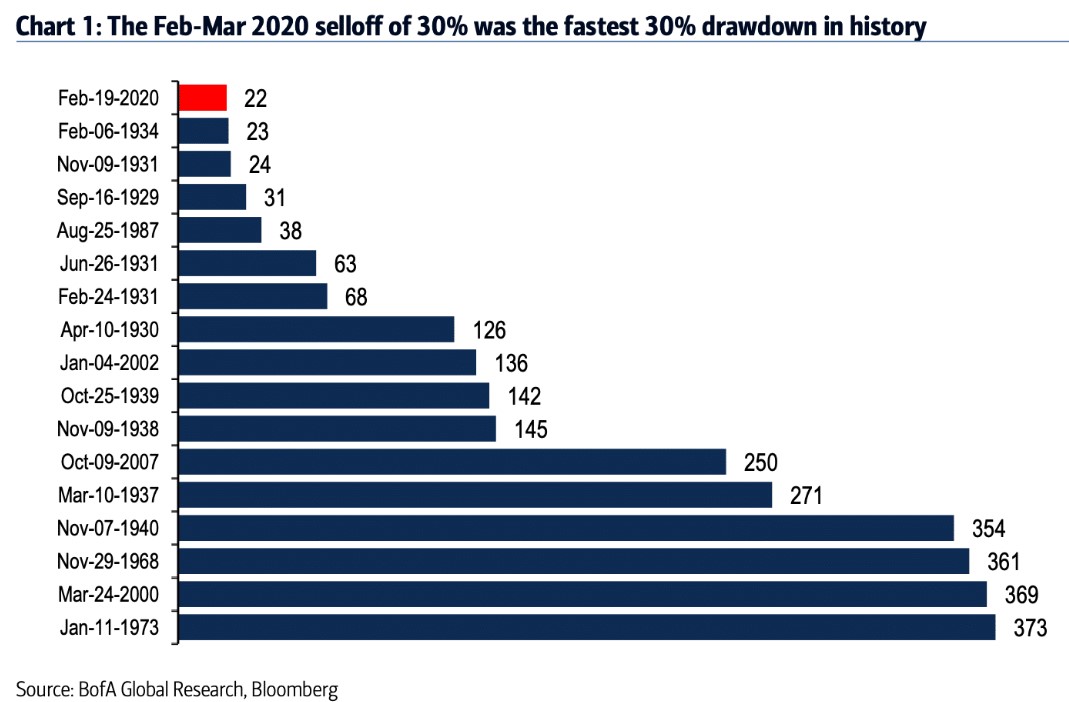
Banks of American found this 30% drawdown in stocks was faster than any other period in history:
The economic output we’ll see in the coming months may also look Great Depression-esque.
The St. Louis Fed’s back of the envelope calculation says the unemployment rate could get as high as 32% next quarter. During the Great Depression, the unemployment rate reached 25%.
One member of the Fed says its possible GDP falls 50% from the shutdown. The scary GDP estimates we’re seeing these days are annualized so it may not be as bad as it sounds but those are still contractions we haven’t seen in many decades.
During the Great Recession, GDP “only” fell 5.1%. The average GDP decline since 1948 is -2.3%, with the worst print coming during the 2007-2009 contraction. The United States hasn’t experienced a double-digit decline in economic activity since the post-WWII recession but prior to that is was commonplace:
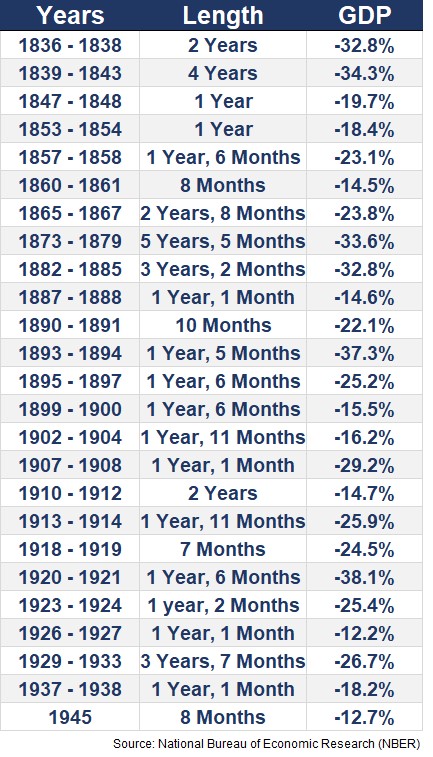
Depending on when things get back to normal, it’s possible 2020 doesn’t end up on this list but this will likely be one of the worst U.S. recessions of the past 100 years.
With so many companies impacted by the shutdown from the pandemic, the coming earnings numbers are going to fall off a cliff as well.
Using data from Robert Shiller I looked back at the history of earnings declines going back to 1871:
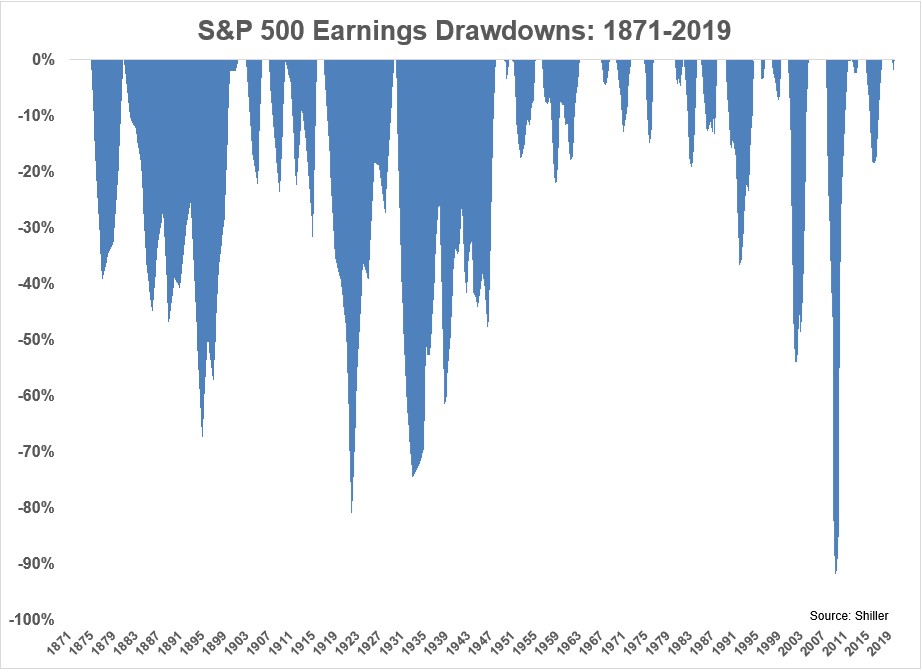
Corporate earnings fell more than 70% during the Great Depression. Earnings numbers fell more from 2007-2009 but this figure is difficult to compare over different historical periods because the rules on how companies account for earnings have changed over time.
But it’s possible the fall in quarterly earnings could rival some of history’s worst drawdowns too.
Some people will look at these numbers and assume we’re heading down a similar path as the depression.
I don’t know how bad things are going to get because the economy has never been effectively shut down like it is at the moment. I’m hopeful a massive recovery is on the other side of this once everything goes back to normal but that’s not guaranteed.
However, there are a number of differences between 1929-1932 and its aftermath and the current situation.
The Fed. The Federal Reserve was still relatively new during the Great Depression, having been founded just 16 years prior. Not only did they pour gasoline on the fire during the speculative period leading up to the crash, but they did next to nothing in trying to stop the crisis as it was unfolding.
John Kenneth Galbraith once wrote, “The Federal Reserve Board in those times was a body of startling incompetence.”
In the current crisis, the Fed has acted fast and they’ve gone big. Central banks around the globe have pumped liquidity into the system to make sure the plumbing of the financial markets continues to function.
This was not happening during the Great Depression and it’s one of the reasons there was a run on the banks and a huge number of bank failures.
Government Spending. During a severe economic contraction, individuals and corporations spend less money so it’s typically up to the government to make up for this shortfall.
During the Great Depression, they did the opposite. Republicans and Democrats alike sought to balance the budget and cut spending. Even in 1932, at the depths of the depression, they wanted to shrink government spending by 25%.
Today, we’re getting $2 trillion in fiscal stimulus rescue funds plus another $4 trillion in loans from the Fed. It’s likely we’ll need even more government spending depending on how long it takes to beat the virus.
The Great Depression saw a reduction in government spending while we’re going to throw 10% of GDP at this thing (and potentially more).
Here are a few other things that didn’t exist during the Great Depression — social security, the SEC, Medicaid & Medicare, FDIC insurance or unemployment insurance.
Many of these programs were created in the aftermath of the depression so most people had no backstop at the time which only made things worse. This is one of the reasons there a bonafide recovery didn’t take place in the years following this downturn. The unemployment rate was still 20% in 1938, a full six years after the Great Depression had ended.
The lack of a social safety net is one of the reasons a generation of Depression Babies changed their saving and spending habits following the crash for years to come. If the government continues to help with fiscal rescue packages, that may not be the case this time around.
Markets. Financial markets and the financial services industry, in general, were both far less mature in the 1920s and 1930s. Leading up to the 1929 crash, only around 1% of the population was invested in stocks, mostly on margin, and traded them in bucket shops (which were glorified casinos).
Today, 50% of Americans are invested in the stock market. Back then there were no 401ks or IRAs or periodic contributions into the market. There were no sovereign wealth funds, financial advisors, targetdate funds, or computer-based trading strategies building diversified portfolios of assets that were rebalancing from bonds to stocks in the midst of the crash.
At the worst point during this drawdown, U.S. stocks were down roughly 34%.
To get to the level of losses seen during the Great Depression stocks would have to fall another 30% from there. Then they would have to fall another 30% from there. Next would be another 30% loss from that point and yet another 30% decline from there.
We would need to four additional 30% losses before reaching Great Depression-era losses.
Could this happen?
Anything is possible. But in the markets you can’t simply invest based on what’s possible but rather what’s probable.
In some ways, the economic backdrop of the coming months will be similar to the Great Depression. In other ways, we are far better off.
I don’t know how things will play out because they weren’t dealing with a global pandemic back then.1
But I am hopeful our response to the crisis this time around means things won’t get as bad as they did during the 1930s.
Further Reading:
How Did We Ever Get to the Roaring 20s?
1That generation lived through their own pandemic 11 years earlier.

