The old saying is stocks take the stairs up but the elevator down. In bear markets, however, the elevator seems to go in both directions.
The S&P 500 just experienced a historic bounce from the March 23 lows:
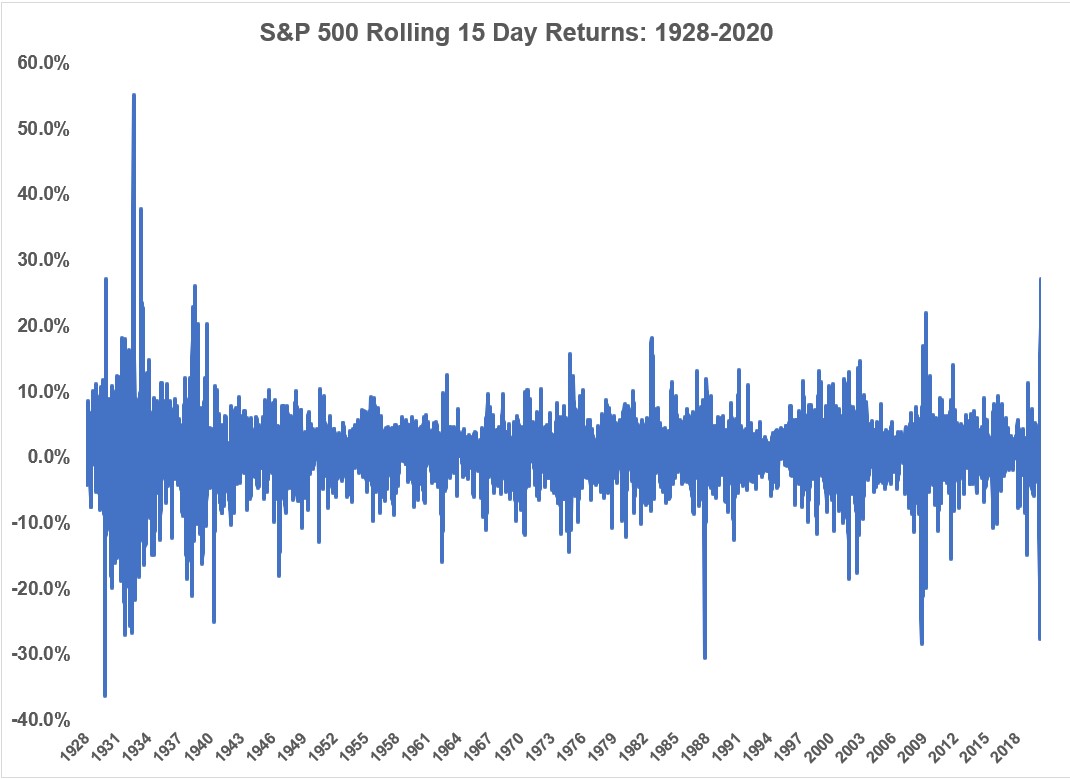
Stocks were up more than 27% in just 15 trading days.
The U.S. stock market hasn’t been up 20% or more in that short of a window since 1938. As you can see from the graph, every other time stocks jumped by such an impressive amount in such a short period of time occurred during the 1930s (and once in 1929).
These previous periods have something else in common as well — they all took place following a massive short-term dive in the market
Here’s a list of every 20% or more 15-day return in the S&P 500 going back to 1928 along with the 15-day decline that preceded it:
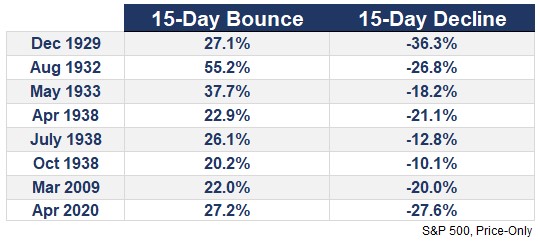
So every time stocks saw a huge 15-day spike it was coming off a huge 15-day plunge.1
It’s hard to gauge what these bounces mean through the lens of history because this list is littered with dead cat bounces, market bottoms and echo-corrections from previous bears.
December 1929 is an obvious candidate for a dead cat bounce. The Great Depression was just getting started at that point.
The lows of the Great Depression were in by August 1932 but there was still plenty of volatility that carried through to 1933.
The 1937-1938 bear market is underappreciated historically because it happened in the same decade as the Great Depression but you can see there was still plenty of volatility involved. That April 1938 bounce was the end of a 55% market crash but you can see the wild moves continued for the remainder of the year.
And of course, the massive move up in March 2009 marked the end of the 2007-2009 crisis.
There’s an old saying that goes something like, “Tell me where I’m going to die so I don’t go there.”
This is the same line of thinking investors have during a bear market. Except the bear market version goes, “Tell me how bad the bear market is going to be so I don’t stay invested until then.”
This situation would be much easier from an investing perspective if we all knew how bad things were going to get.
Did stocks already bottom? Is there another leg down from here? How bad could things get? Is it crazy to think we’ll hit new highs this year? Next year? What if markets stay rangebound for a few years?
These are unanswerable questions but worth pondering nonetheless.
Many people are trying to compare the current market to the Great Depression to get a better sense of the loss potential.
Investors would love to know if the worst is in or more pain is to come but the better comparison to the Great Depression is probably from a volatility perspective.
March was the most volatile month of daily price swings since that time. The bounce we saw over the past couple of weeks resembles similar activity to the ups and downs of markets in the 1930s.
I don’t know how any investor could be certain about anything at the moment.
Maybe instead of trying to figure out how bad losses will get investors should resign themselves to the idea that market volatility will remain elevated for some time as we try to work out how bad things will get during this crisis.
Further Reading:
The Corona Crisis vs. The Great Depression
1The 15 day number doesn’t match up perfectly with the entire downfall but does work to show how quickly these things can occur.
