On a total return basis, the S&P 500 is up almost 22% on the year.1
To state the obvious, this means the underlying securities included in the S&P 500 are having a good year as well.
But there’s still a wide range in outcomes for the performance of the individual stocks in the S&P.
For instance, the best performer through this past Friday was Chipotle (CMG), which is up nearly 83% on the year. That’s much better than the worst performer, Abiomed (ABMD) which is down more than 42%.
The winning percentage is pretty good this year, with 86% of stocks showing positive returns through September 13. This means 14% of stocks are down on the year.
And even in a strong market this year there are still a decent number of stocks down a decent amount.
In fact, 33 stocks have fallen more than 10% in 2019. 19 stocks are down 20% or worse. And 5 companies in the S&P 500 have seen losses of 30% or worse this year.
Well-known companies such as Macy’s (-39.7%), Kraft (-29.6%), Halliburton (-23.9%), Trip Advisor (-23.5%), and Gap (-23.1.%) are all down big. A rising market has not lifted all boats this year.
Here’s the range of performance among S&P 500 stocks in 2019:

And here’s the path each stock in the S&P 500 has taken in 2019 (courtesy of Nick Maggiulli):
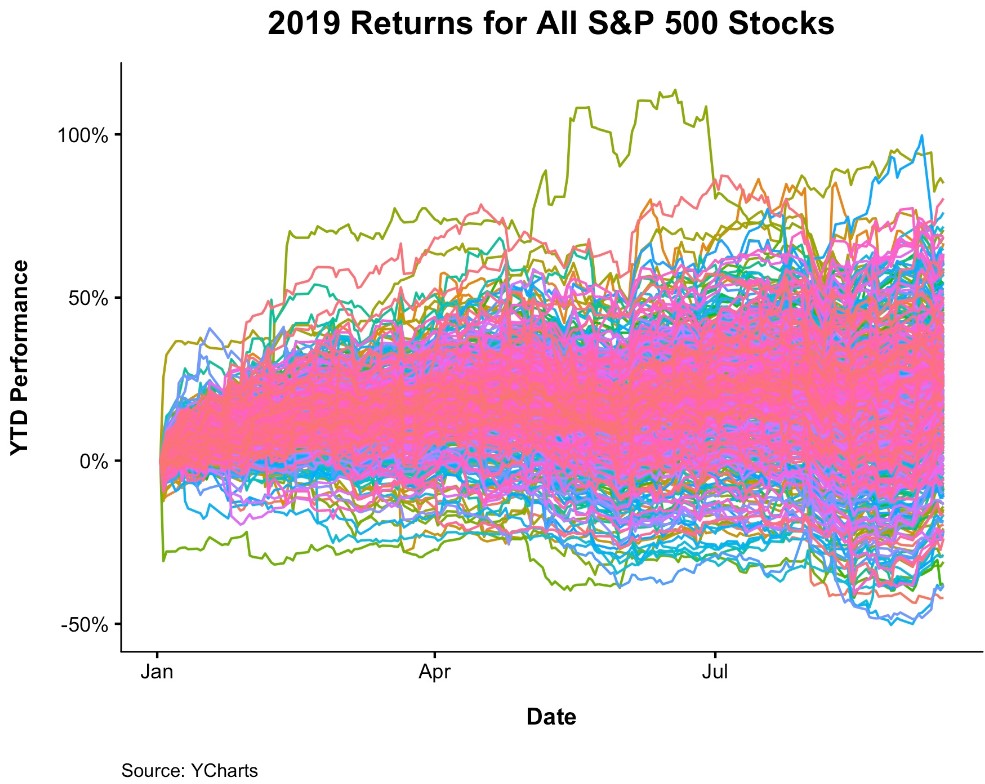
The old saying is it’s a market of stocks, not a stock market.
I hate to keep harping on this but…

…there’s a growing chorus of investors who believe individual companies are being pushed around by flows into index funds and ETFs.
I suppose its possible companies outside these indexes are being punished for not being included but it doesn’t appear that flows are propping up every name just because it’s included in the S&P 500.
Investors often point to correlations to understand how markets, asset classes or stocks behave relative to one another but dispersion may be a better measure of the volatility of individual companies in an index or benchmark.
When dispersion is high, there is a wide gap between the best and worst performers in the stock market. And when dispersion is low, the gap between the best and worst performers narrows.
According to Vanguard dispersion in the overall market hasn’t been impacted by flows over the years. They looked at the percentage of stocks in the Russell 3000 that have either underperformed or outperformed the index by at least 10% by year:
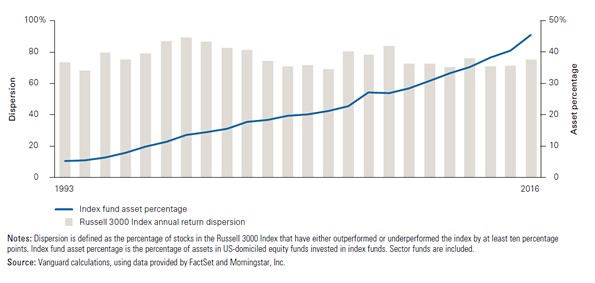
Thet also overlaid the growth in indexing by showing the increase in index funds as a percentage of the overall US equity fund category. Dispersion has remained fairly similar since the early-1990s.
Flows into and out of certain fund types may add to short-term volatility in certain funds, industries, factors or stocks but company fundamentals, trends, and profits will still win out in the long-term.
It’s always and never a stock-picker’s market. It really depends on which stocks you pick, as always.
*******
And if you still can’t get enough of this argument about the passive bubble, check out the first few minutes of our podcast from last week:
Now that we have a new videographer, Duncan, on staff, we’re planning on putting some clips every week from Animal Spirits on our YouTube channel.
Further Reading:
$10,000
1Yes I am aware this number is juiced by the fact that stocks fell hard in the 4th quarter of 2018 and that YTD numbers are somewhat arbitrary. Goes without saying.
