Slack is a lot like Twitter from my vantage point.
It’s a service I use all the time. It’s become an integral part of my life from both a work and social perspective. Every time I talk to someone else who uses the service they share my love for the platform. And it’s almost impossible to explain its usefulness to someone who has never used it before.
Slack has been one of the big reasons RWM is able to have offices around the country. It’s more or less replaced internal email at our firm and allowed us to more effectively communicate and share ideas with one another across state lines and time zones.
The initial idea behind the messaging company was actually something of a fluke.
Stewart Butterfield and team had tried unsuccessfully for a number of years to get a multiplayer online game off the ground. When he finally pulled the plug and shut down the effort, he realized their next venture could come from the communications system they used while setting up the game.
That communication platform allowed various members of the team to have conversations on different topics, in different groups and archived every conversation so they could look back if necessary. In 2012, this became Slack, which now has upwards of 8 million daily users.
The company was valued at $5 billion after its last round of fundraising, making founder Butterfield a rich man.
On a recent episode of How I Built This with Guy Raz, Butterfield was asked how this enormous wealth has impacted his life. He told Raz, “beyond a certain level of wealth it doesn’t make your life any better.”
He went on to list what he considers to be the three levels of wealth:
Level 1. I’m not stressed out about debt: People who no longer have to worry about their credit card debt or student loans.
Level 2. I don’t care what stuff costs in restaurants: How much you spend on a particular meal isn’t impacted by your finances.
Level 3. I don’t care what a vacation costs: People who don’t care how expensive the hotel is or which flight they go on.
This was a new way of looking at this and it got me thinking about where most Americans find themselves on this scale.
Data from a recent report from the Congressional Budget Office shows people at the top of the income scale have experienced the most gains in their ability to not care about vacation costs since 1979:
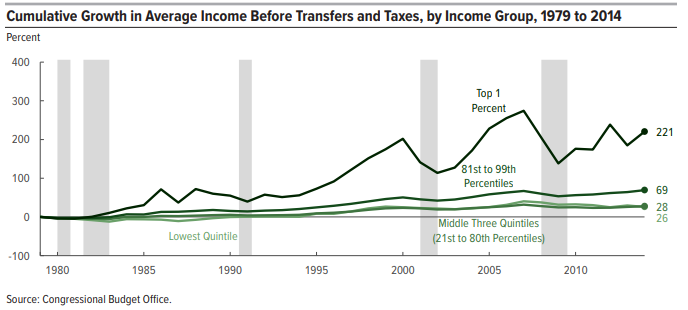
The top 20% of earners saw their income rise almost 70% while the top 1% was three times higher than that. While the top 20% saw gains of almost 70%, the bottom 80% saw gains of just 27%.
Data from Pew Research breaks down the share of households in five different income levels since the 1970s:
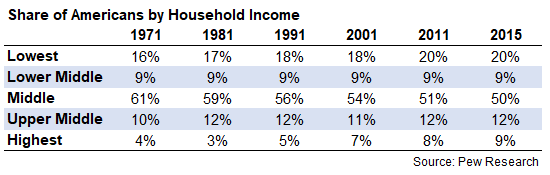
It appears there are more people who don’t have to worry about how much they spend on vacations, fewer people who don’t have to worry about how much they spend at a restaurant and more people who have to worry about debt.
On the one hand, it’s nice that more people are now in the upper middle and highest income brackets than in the 70s and 80s. On the other hand, it’s not a great look that there are now more people on the lowest rung.
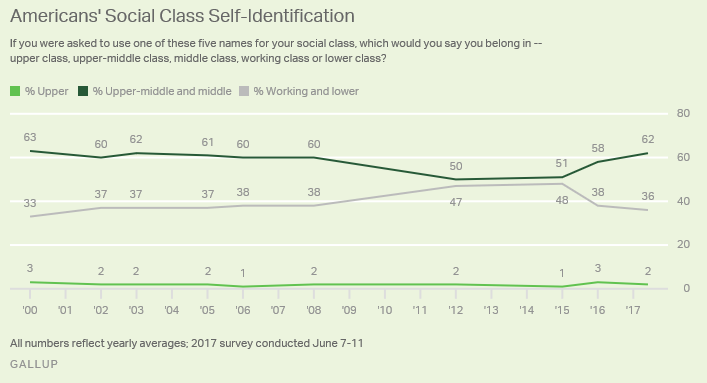
The middle class has seen the greatest decline in this time, but according to a Gallup poll, most people in the upper class don’t even realize they’ve made it to the top:
Pew also broke things out in terms of middle and upper-income classes by the number of people in a household:
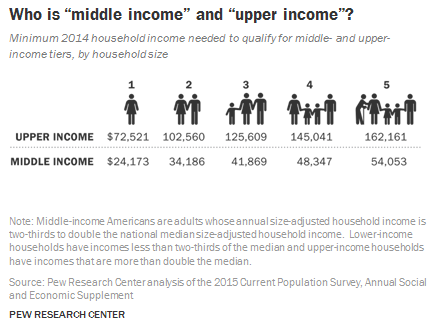
The fact that you need to make more money to support a larger family could be one of the reasons fertility rates are dropping so precipitously in the U.S.
Income is not the same thing as wealth, so it makes sense to look at the net worth numbers as well.
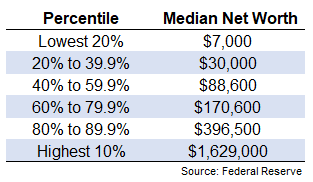
According to the Federal Reserve, as of 2016, the average net worth of American families is just shy of $100,000. But the median wealth for the top 10% is over $1.6 million while the top 1% holds almost 40% of the country’s wealth.
The Fed also broke out the net worth figures by various percentiles:
The Great Recession and the ensuing recovery have had a massive impact on household wealth depending on where you fall. The Minneapolis Fed just released a study that shows how damaging the crisis was on the bottom 50% and how wonderfully the top 10% has made out:
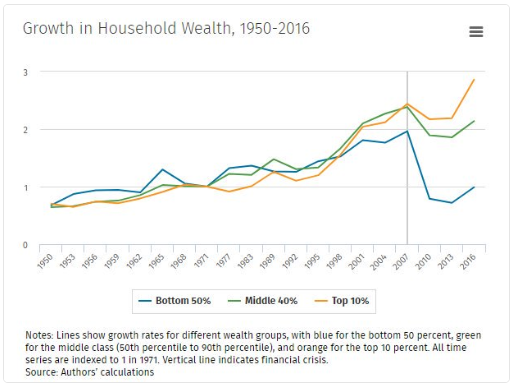
Much of this wealth disparity comes from the fact that the top 10% of households own 84% of the stock market, which is up from 77% in the early-2000s. I’m afraid two enormous crashes over a 10 year period has likely led an entire segment of the population to shun the stock market for good.
These charts don’t tell the whole story of course.
The standard of living where you choose to reside can have a huge impact on how far any of these income or wealth numbers can get you. And how much or how little you choose to spend of that income or wealth also plays a role. Lifestyle inflation can be a killer if you’re not careful, no matter how much money you make.
Butterfield’s three levels of wealth aren’t all-inclusive but I like the fact that he frames them in personal finance terms people can understand. It’s a tad depressing that we now have so many people reaching the top level but so many others who struggle to reach the first level of wealth.
Further Reading:
Inequality in the Stock Market
This post originally ran on August 2, 2018.

