Jason Zweig recently chatted with the ever-candid Charlie Munger, who had this to say of value investors:
The money managers among them are “like a bunch of cod fishermen after all the cod’s been overfished,” Mr. Munger tells me. “They don’t catch a lot of cod, but they keep on fishing in the same waters. That’s what’s happened to all these value investors. Maybe they should move to where the fish are.”
This same analogy may apply to institutional investors who overfished the illiquid, alternative investment universe by following David Swensen’s lead at Yale.
One of the best and worst parts about this space in my experience is how much sharing — of investment ideas, manager due diligence, best practices, etc. — there is amongst peers in the industry.
An unintended consequence of this sharing is an infatuation with the peer performance.
The peer benchmark the majority of the foundations and endowments crowd focuses on every year is the NACUBO-TIAA Study of Endowments. The latest study of more than 800 college and university endowment funds which manage more than $600 billion was released this past week.
Even the foundations and endowments that aren’t affiliated with educational institutions use these numbers as a peer benchmark because the college endowments have always been seen as best of breed in the institutional money management world.
And for a long time they were.
But there’s an old saying that nothing breeds failure like success on Wall Street. Here are the latest return numbers from NACUBO segmented by assets compared against the simple three total index fund portfolio from Vanguard1:
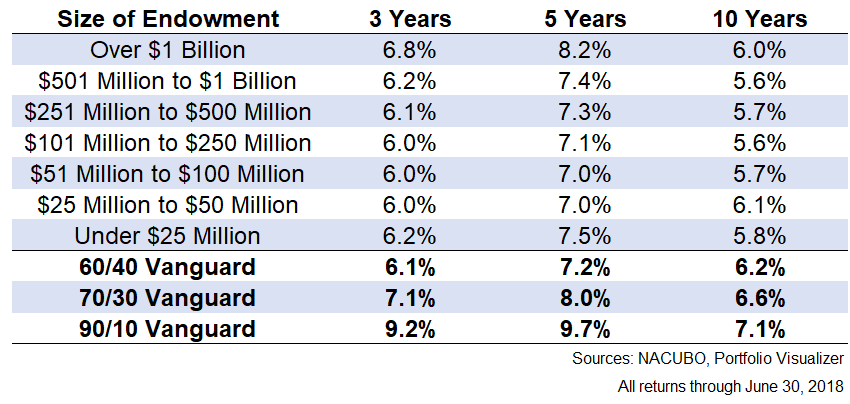
Many investors like to use the 60/40 portfolio as a benchmark but I showed other variations of the Vanguard index portfolio because the asset allocations for these endowments are all over the map:
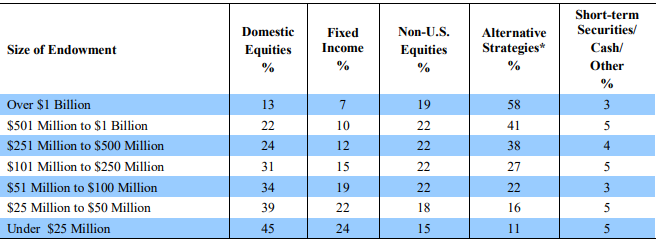
I would argue 60/40 is far too conservative when you consider none of these groups show an average of close to 40% in bonds. In fact, the highest average allocation to bonds and cash is just 29% for the under $25 million cohort. The funds that have over $1 billion average just 10% in cash and fixed income. You could argue a 90/10 stock/bond benchmark is far more appropriate for this group.
These investors would tell you their hedge funds don’t have the same risk profile as stocks so it’s unfair to compare the two. But my contention is those funds with nearly 60% in alternatives are taking on even more risk than stock market investors.
Alternatives are illiquid. Investors rarely know what the underlying holdings are. Private equity and venture capital are illiquid, levered equity positions. Hedge funds also utilize leverage. In my mind, that makes these positions far riskier than a diversified low-cost stock market index fund. Even if the volatility looks lower in these funds from their reported numbers, it’s masked by the inherent illiquidity.
Some further thoughts on these numbers:
- It’s hard to believe how close the return numbers are between the large funds and the small funds. In the past, the funds with the most money tended to outperform their smaller brethren. Larger funds have more resources, better access to top fund managers, more money to invest in technology, bigger travel budgets, etc. But the competition in this space has all but leveled the playing field so much so that the best performing group over the past 10 years was the $25 to $50 million endowments, not the ones managing more than $1 billion.
- The fact that the long-term return numbers for these funds are all so similar is striking when you consider how different their asset allocations are (not to mention the differences in managers or funds in those asset classes). The biggest endowments have dozens of staff members who specialize in specific asset classes or strategies. Some of these people are paid millions of dollars a year. They travel all around the globe meeting with money managers and performing due diligence on investment opportunities. They have enormous committees and boards filled with highly connected and educated people. And yet the little college endowments — with far fewer people, in far simpler investment strategies, using much smaller budgets and making much less money than the giant endowments — did just as well.
- The sheer size of the alternative allocations for the endowments with $251 million and up is mind-boggling when you consider the amount of time, energy, know-how, and resources required to perform due diligence, monitor, and understand exactly how these investments function. These funds basically doubled down on illiquid investments following the financial crisis, even though many of them got burned when they needed liquidity the most.
- I don’t think there is a plan B for these endowments. They all spent so much time and effort convincing their boards this was the right plan of attack they can’t turn back now. My guesstimate is 60-70% of these funds really have no clue how their private investments are performing because these funds are so difficult to track and they won’t know how this experiment will turn out for many, many years. I think the majority of them will be sorry.
- The illiquidity premium was assumed to be a foregone conclusion by any institutional investors. It’s time to reassess this idea.
- Maybe the past decade is an aberration. Maybe the bull market has skewed these numbers and the biggest funds will once again prevail over the next decade. Anything is possible. But I think it’s more likely the days of dominance are over for the biggest endowments. Their first mover advantage is gone. There’s too much competition for hedge funds and private equity for these institutions to consistently select the top quartile managers (and trust me, they will all tell you they’re going to be top quartile).
- There will obviously be funds that do better than others and I wouldn’t count out people like David Swensen just yet. But all of those CIOs and funds trying to copy Swensen should realize high-costs, illiquid fund structures, complex portfolios, and hard-to-understand investments create a ridiculously high hurdle rate. Most of these funds would be better off simplifying their approach.
Further Reading:
Peer Pressure
1The three funds used here were Total U.S. Stock Market Index Fund, Total International Index Fund, and Total U.S. Bond Market Index Fund. The split between U.S. and foreign stocks was 3-to-2 since that was the average allocation for the endowments.

