It’s become an annual tradition on this blog to update asset class returns on an asset allocation quilt I created for a few reasons:
(a) Asset allocation is typically the most important aspect of portfolio management so understanding how the various asset classes performed is instructive when trying to understand your results.
(b) This is a useful exercise to remind myself how difficult it can be to pick the best (or worst) performing asset class in a given year.
(c) You can learn a lot about how markets function by looking at performance in this way.
Here are the past 10 years of returns along with the annualized 10 year results:
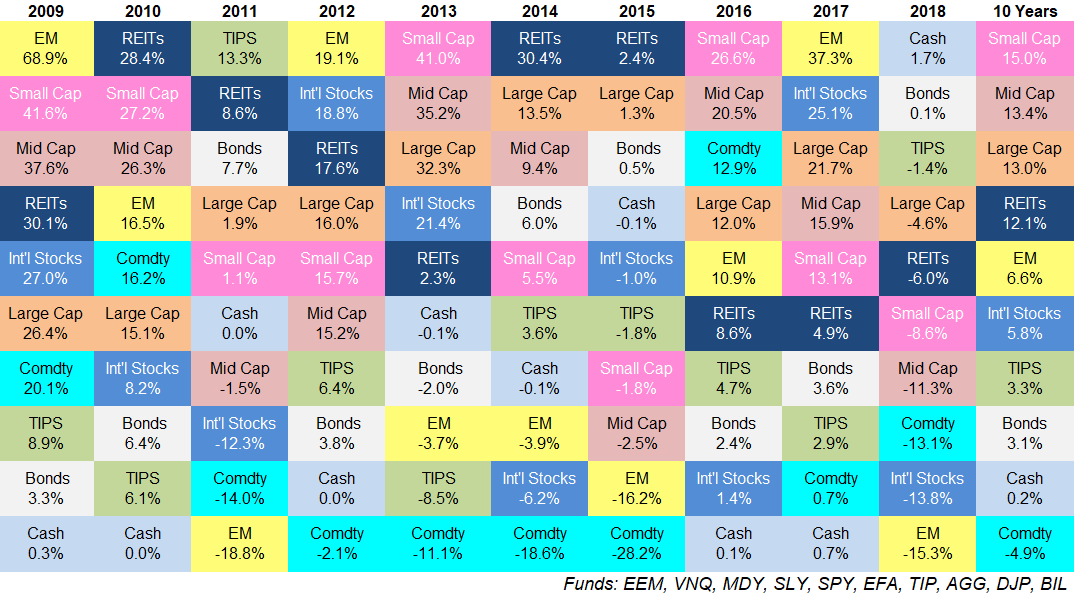
Some comments:
- This is the first time in 10 years cash has outperformed everything else. Not only did cash outperform, but basically everything else had a negative return (bonds were barely in the black) and cash finally returned something after years and years of paltry yields.
- The Barclays Aggregate Bond Index dates back to 1976. In that time the Agg has never had a down year in the same year that the S&P 500 was down. This year was oh so close but it eeked out a minor gain (it also helps that the Agg has only had a total of 3 down years in that time, thanks to the high starting yields and 40+ year bond bull market).
- If 2017 was the year that everything worked then 2018 was the year that nothing worked. All asset classes tracked here were up in 2017 while 8 out of 10 were in negative territory this past year, with an average loss of 9.3% for those asset classes that finished in the red.
- Large cap U.S. stocks and REITs have been ultra consistent in this period. You can see neither asset class has spent any time ranked below 6th (out of 10 asset classes). Mean reversion would dictate that eventually, they would spend some time towards the bottom of the list but good luck predicting when that will take place.
- Even after the sub-par 2018 campaign, the 10 year returns for U.S. stocks are spectacular. Small caps, mid caps, large caps, and REITs have all seen solid double-digit annual returns since the start of 2009. To put these numbers in perspective, if each of these four asset classes went nowhere for the next 5 years, giving investors a total return of a big fat zero, the 15 year annualized returns would still be 9.7%, 8.8%, 8.5%, and 7.9%, respectively. Those are pretty great returns in a scenario where a market goes nowhere for one-third of the entire period.
- Of course, the numbers above show the past 10 years, which means the 2008 numbers finally dropped off. Just for fun let’s look at the 11 year numbers to include the huge down year in 2008:
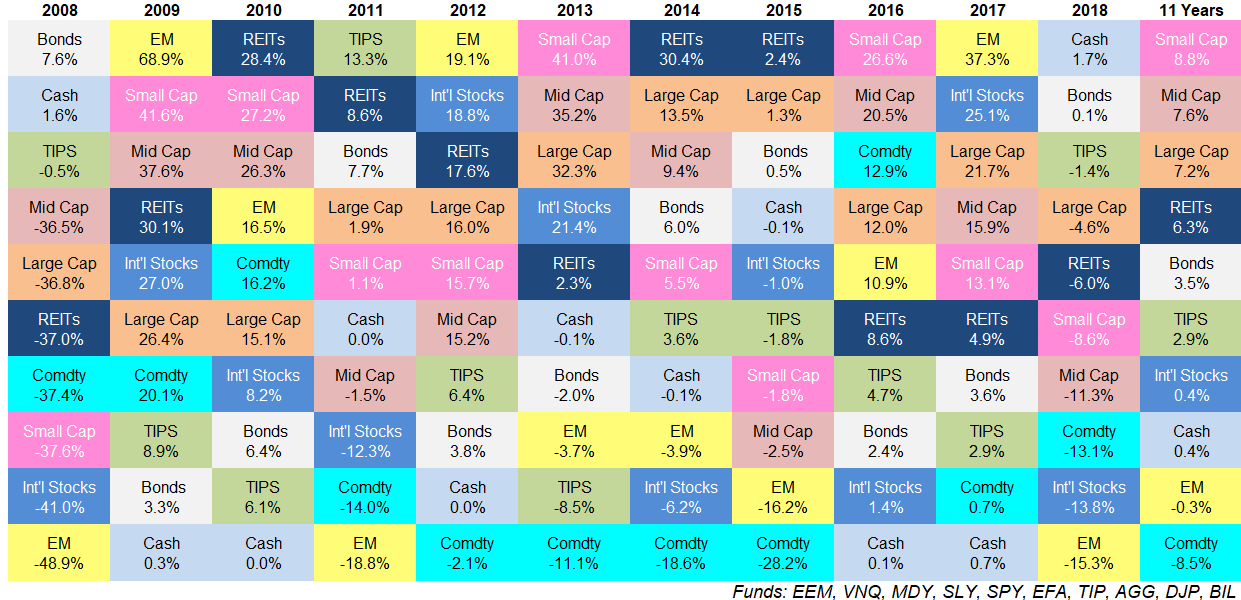
- Now you can see that the 11 year returns for U.S. stocks, although still not terrible in the grand scheme of things, aren’t nearly as high when you include the crash of 2008. I’m sure there’s some intelligent commentary for these differences but my biggest takeaway from this type of research is that changing the start or end dates for your analysis can lead to vastly different outcomes and conclusions.
- Over the past 10 years emerging market and foreign developed stock returns were below average but including the 2008 period makes them look downright awful. Not only did U.S. stocks crush the rest of the world, but bonds and even cash outperformed international stocks since 2008.
- Commodities continued their dreadful run in 2018. Not only were commodities down 37% in 2008 but they were then down an additional 40% form 2009 to 2018 for a total drawdown since 2008 of more than 62%. Commodities tend to live in an enormous boom/bust cycle so I would expect to see violent rallies at some point, but things have been painful for a long time in that space (listen here for more on this topic).
- It’s also important to remember that diversification, while difficult to administer in any given year, can stamp out a lot of the moving parts on this chart. I took a simple equal-weighting (labeled EW) of the 10 asset classes used here and added that to our quilt:
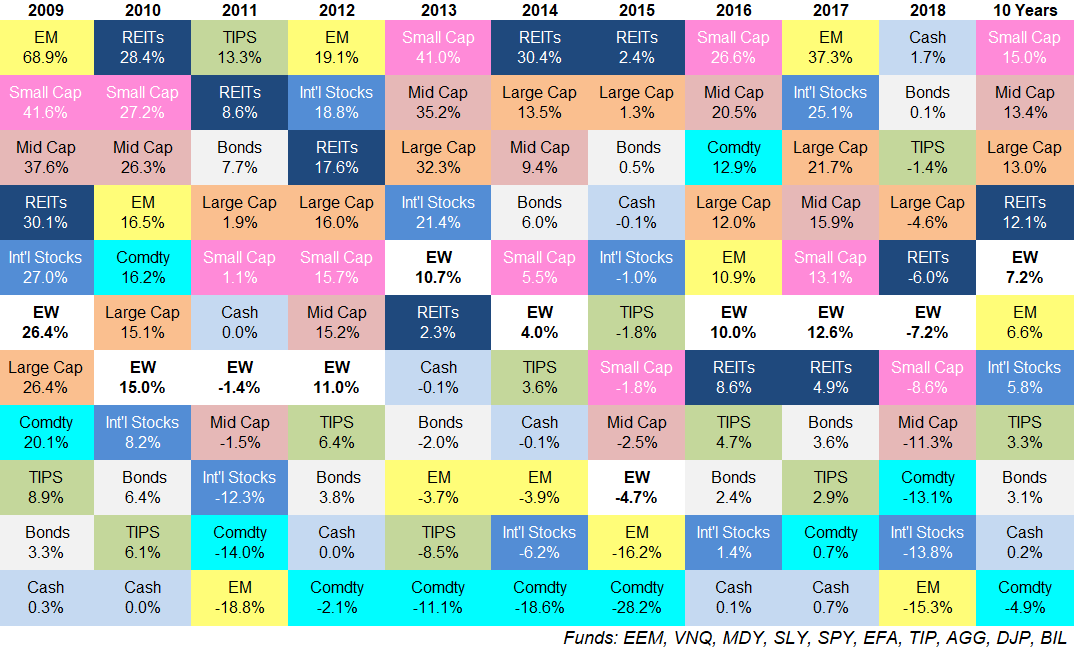
- You can see the asset allocation portfolio is never too hot or too cold. It’s never going to be at the top of the heap but it’s also never going to be at the bottom of the pile either. This consistency of returns can help investors from an emotional perspective, but it’s also a wonderful tool for risk management. This is especially true of retirees who are forced to deal with the sequence of return risk. Diversification feels useless in any given year but it remains one of the best ways to manage risk over the long-term, the only time horizon that matters to investors.
Further Reading:
2017 vs. 2018 in the Stock Market
