Last week I wrote that the one constant in the stock market is losses.
And not just minor losses but losses of the double-digit variety. The S&P 500 has experienced at least one double-digit drawdown in half of all years going back to 1950.
The bond market tells a different story.
Investors in high-quality bonds aren’t used to seeing losses on their statements for the simple fact that bonds don’t go down nearly as much as stocks. And when they do go down, the drawdowns are much shallower in nature.
I like to say a bad year in the bond market is like a bad pre-market futures session in stocks.
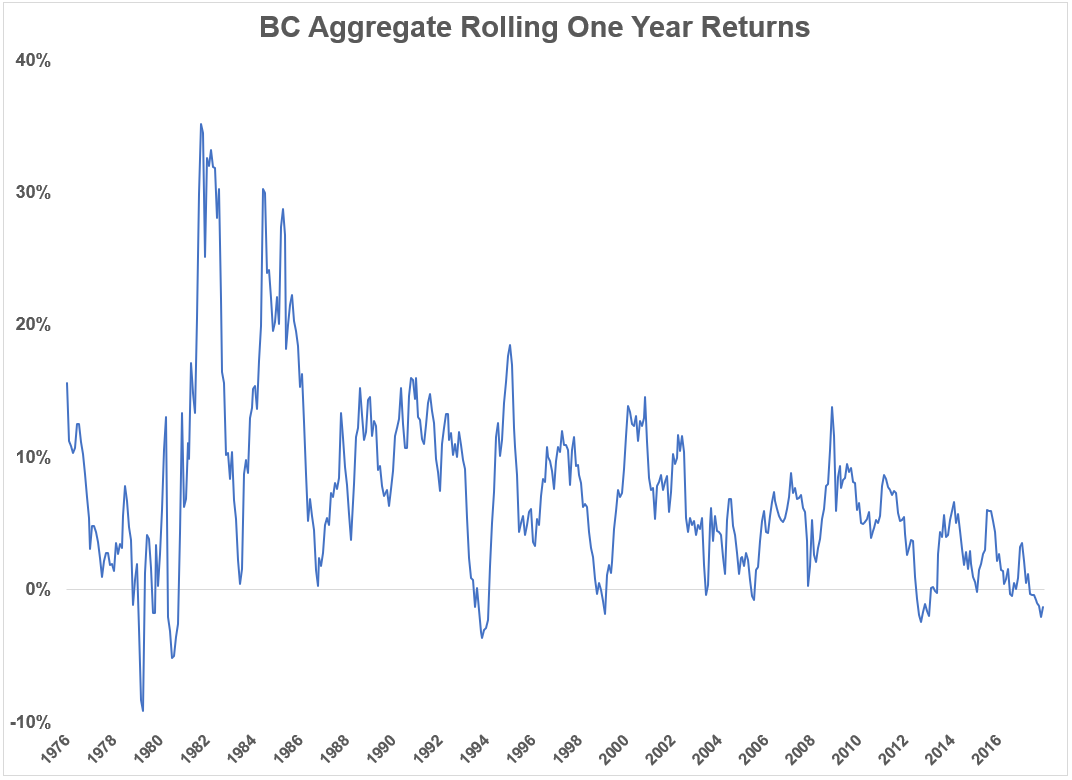
To quantify this for bond investors I looked at the BC Aggregate Bond Index, a good proxy for the high-quality U.S. bond market, going back to its inception in 1976.1 These are the rolling 12-month returns since inception:

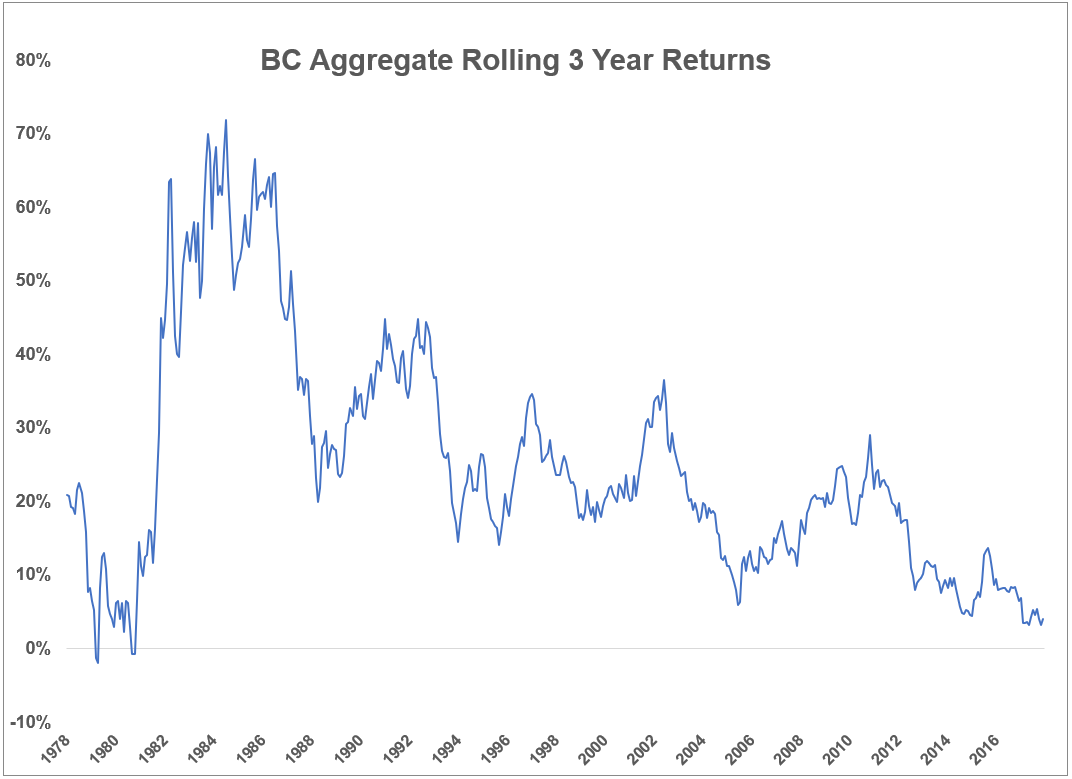
Returns at month-end have been lower during the previous 12-month period just 9% of the time since 1976. And the largest drawdown using month-end values was just 9.2%. Things look even better over rolling three-year periods:

There hasn’t been a negative three-year return at month-end since 1981 and even that was a tiny 2% loss. This is something that’s happened in less than 1% of all rolling 36-month periods.
Granted, much of lookback period occurred during perhaps the greatest bull market of all-time.
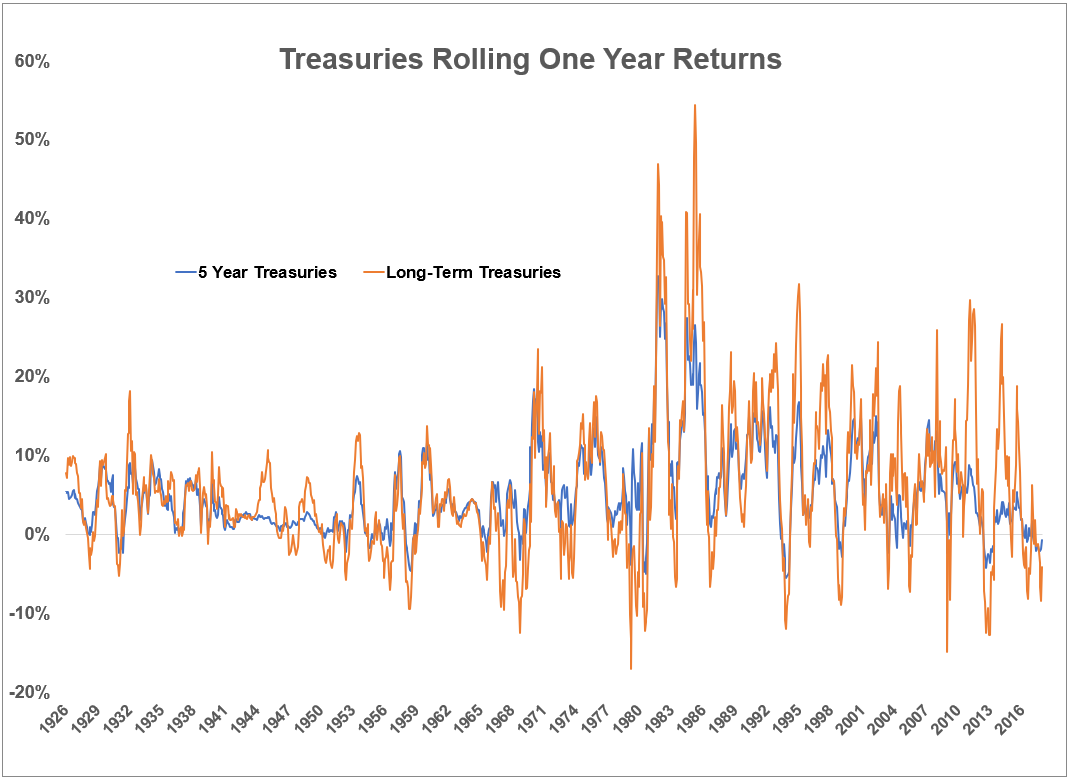
So let’s go back further using 5-year treasuries and long-term treasuries with the same rolling 12-month return window:

Even going back to 1926, returns in 5-year treasuries were rarely in the red over a 12-month time frame. They showed negative returns in just 10% of the rolling one year periods. Long-term bonds are much more volatile because they have a longer duration so losses aren’t as rare in that space. They were in negative territory roughly 23% of all rolling 12-month windows.
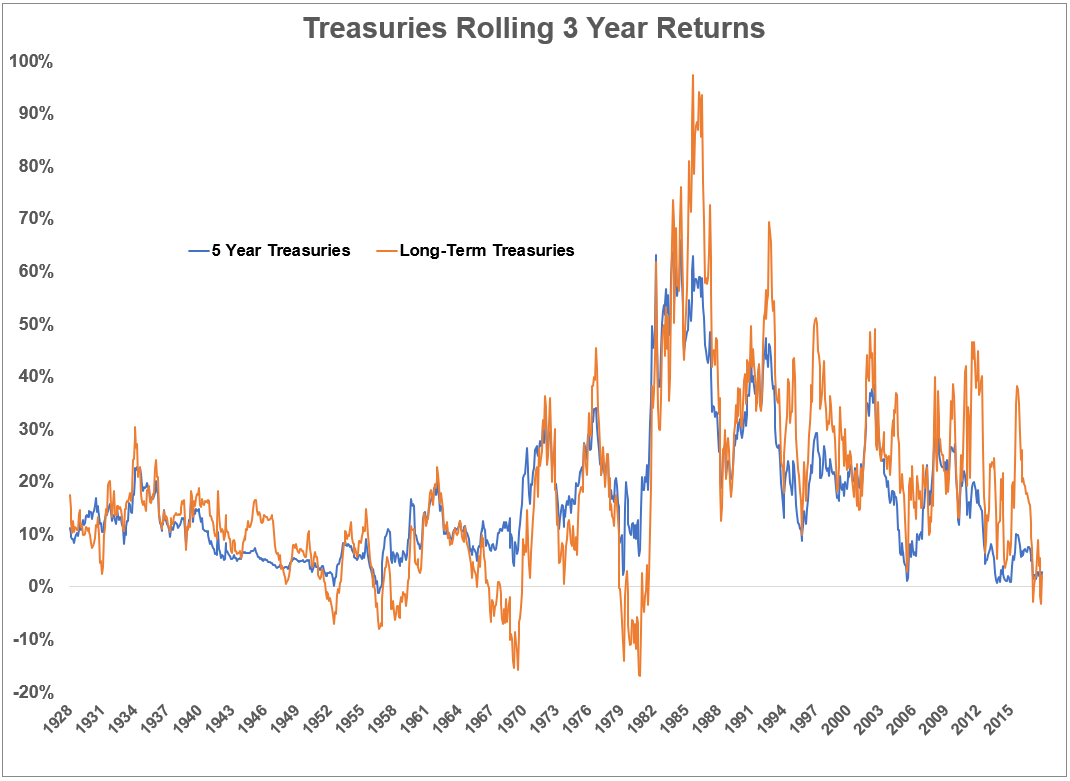
Now here are the three-year results:

Rolling three-year returns were negative in 5-year treasuries less than 0.5% of the time, while more than 10% of the time long-term bonds fell over three years.
I would be remiss if I didn’t look at these same figures using inflation-adjusted terms since inflation is by far the biggest long-term risk in bonds:
- Since 1970, rolling inflation-adjusted 12-month returns for the BC Aggregate were negative 26% of the time (or positive 74% of the time).
- Since 1970, rolling inflation-adjusted 36-month returns for the BC Aggregate were negative 12% of the time (or positive 88% of the time).
- Since 1926, rolling inflation-adjusted 12-month returns for the 5-year treasuries were negative 36% of the time (or positive 64% of the time).
- Since 1926, rolling inflation-adjusted 36-month returns for 5-year treasuries were negative 31% of the time (or positive 69% of the time).
- Since 1926, rolling inflation-adjusted 12-month returns for the long-term treasuries were negative 37% of the time (or positive 63% of the time).
- Since 1926, rolling inflation-adjusted 36-month returns for the long-term treasuries were negative 32% of the time (or positive 68% of the time).
So inflation knocks things down a peg or two but the frequency and magnitude of losses in bonds doesn’t come close to what you’ll see in the stock market.
If the one constant in the stock market over the years has been losses, the one constant in the high-quality bond market has been slow and steady gains. This hasn’t always been the case in long duration treasuries but relative to stocks, bonds are rarely down, especially when taking the lookback period out to three years.
This is one of the reasons so many investors these days are more worried about bonds than stocks. We’re used to seeing losses in the stock market. That’s not the case in bonds, even when the losses are so small by comparison.
If the right expectations aren’t set going into it, even slightly elevated volatility in the bond portion of the portfolio could cause investors to make mistakes in the coming years.
Further Reading:
The One Constant in the Stock Market
1All rolling returns in this post through the end of Nov. 2018.
