Something rare happened in the S&P 500 this year.
The index has experienced a double-double-digit drawdown (kind of like double secret probation?) for the first time since 1990. That means the S&P 500 fell 10%, made those losses back, only to fall 10% yet again. The only other years on record I could find when this happened were in 1946 and 1947.
These types of stats make for interesting market fodder but don’t really tell you all that much other than the fact that most other down years had either much longer lasting corrections or simply didn’t get back to their high watermark before falling again.
It’s also true that double-digit stock market losses in a given year aren’t even that rare. In fact, they’re par for the course.
I’ve used this chart before but it’s worth reposting because we all need reminders during a market correction that they’re perfectly normal and should be expected:
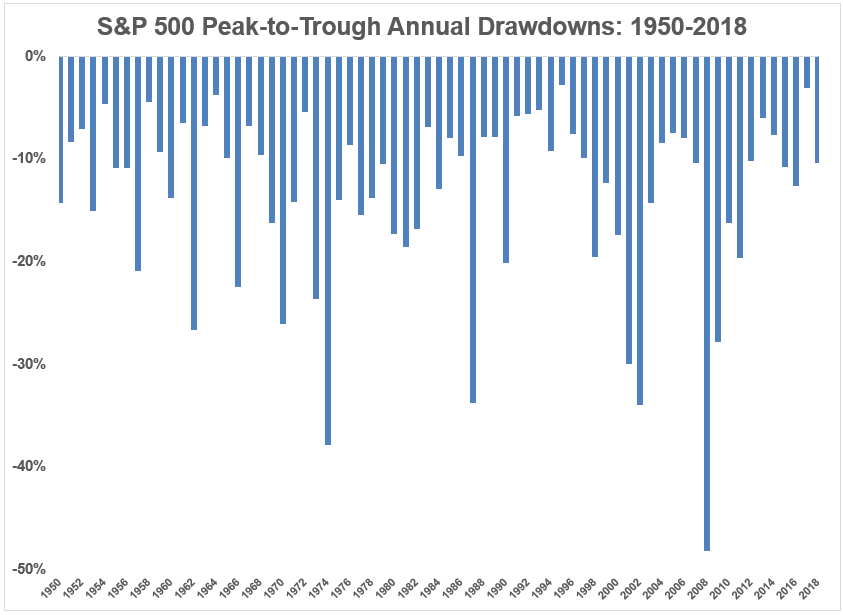
The average intra-year drawdown since 1950 is -13.3%. And more than half of all calendar year drawdowns have been of the double-digit variety:
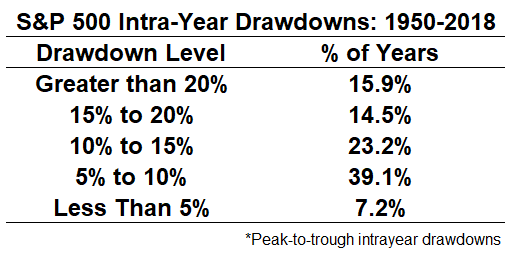
The outlier is actually a shallow drawdown of less than 5% while big losses are the norm.
What’s interesting is that although 36 of the past 68 calendar year periods has experienced a double-digit drawdown at some point, only 14 of those instances ended the year in negative territory. That means more than 60% of the time when stocks fall 10% or more intra-year, they’ve still finished the year with gains.
This has happened five times since 2009 alone:
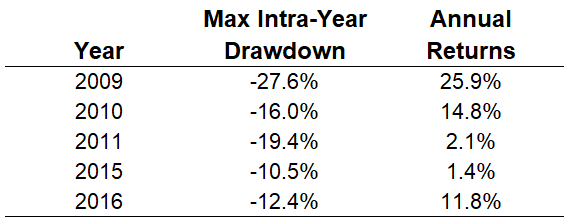
And 13 times out of those 36 years the S&P actually finished the year with positive double-digit returns (as happened in 2009, 2010 and 2016).
I’m not saying that’s going to happen this year as it would take the mother of all Santa rallies at this point to see those types of gains. And it’s possible we’ll end the year with negative returns on the S&P for the first time since 2008 (as of the close Monday it’s up around 0.3% for the year).
I have daily data on the S&P 500 going back to 1928.1 In that time there have been more than 22,600 daily closes. Of those daily closes, less than 1,200 were new all-time highs. Said another way, roughly 95% of the time stocks are not at an all-time high but in some state of drawdown.
You may be thinking to yourself:
But Ben, it’s different this time. The Fed is tightening. We’re at full employment. There’s uncertainty around the tariffs. The rest of the world is in or close to a bear market. Interest rates are (were?) rising. The yield curve is inverting. This is typical late cycle behavior.
These things all seem to be true or true-ish. We certainly could be heading for an economic slowdown which could bring further pain to stocks.
And if we do see a recession and/or bear market in the next 12 months or so it would be the first time in history nearly everyone called it in advance (although you could say 90% of these predictions don’t count as they’ve been made every single year since 2010).
But the point is losses in the stock market are nothing new. And trying to guess their timing or magnitude in advance is a fool’s game. Knowing what we know today doesn’t help predict what’s going to happen next.
I wouldn’t be shocked either way if the losses continue or the market decides to ignore everything that’s going on right now and stages a fabulous rally.
To survive this inherent uncertainty requires an investment strategy that’s durable enough to withstand either scenario without wrecking your portfolio or your psyche.
The risk of loss is the one constant in the stock market that will never go away.
Further Reading:
The Bedrock of Portfolio Management
1Most of which is recreated because the S&P didn’t technically exist until 1957, but still…

