A podcast listener asks:
I know I shouldn’t expect home prices to crater like they did after 2008, but I’m wondering if there is any reasonable expectation that home prices will eventually level off or drop enough to make a buying opportunity. I just want to buy the dip.
We discussed this question on the podcast this week but I decided to do some digging into the numbers to quantify how cyclical the real estate numbers can be in this country. The numbers were fairly surprising but require a wheelbarrow of salt.
The Case Shiller Real Home Price Index goes back to 1890. I ran the numbers to show the year-over-year change in this index to see how often it was positive or negative and what the range of outcomes looks like. I’m not sure how accurate the data is going back that far but the numbers are only given on an annual basis from 1890-1952 and monthly from 1953 on. So I’ve broken down the numbers into those two periods:
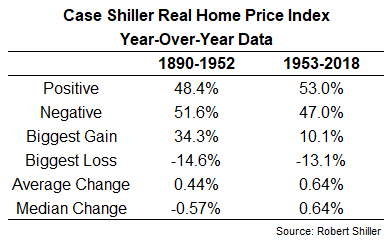
The average down periods during the negative years were -6% from 1890-1952 and -3% from 1953-2018.
In some ways, it’s surprising to see basically a coin flip between gains or losses from year-to-year in both periods. But when you drill down into the data it actually makes sense considering the long-term gains in real estate haven’t been as high as most would assume.
Over the entire period from 1890 to 2018 the total gain after inflation was around 73%. That works out to just a tad over 0.4% annually. The volatility over these two periods was 9% and 14%, respectively, so the fact that gains and losses occurred in similar frequency isn’t all that surprising with such low returns.
Of course, this data covers the entire country. Within the real estate market, there have obviously been regions, cities, neighborhoods, and locations which have done better or worse than the averages.
Case and Shiller have also put together data on a number of the largest real estate markets in the country broken down by city. This data only goes back to 1987 but gives us a better look at how different things can be depending on the location. Again these numbers are based on the year-over-year changes in the individual city home price indexes:
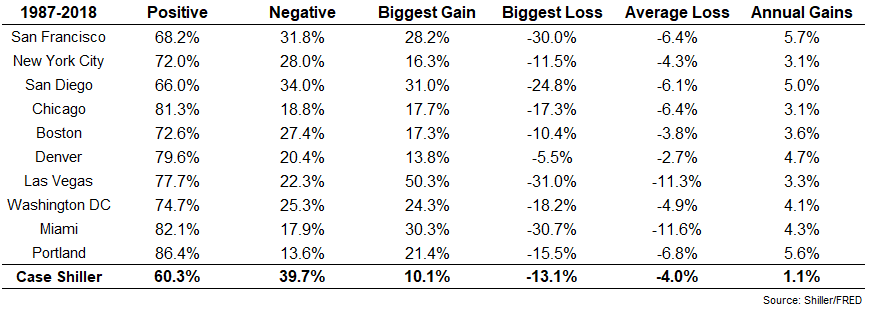
These markets have all shown a higher probability of gains than what shows up in the long-term averages but the overall index looked better over this period as well. What stands out here is the volatility of these bigger markets.
People may also be surprised to see the annual gains look relatively paltry for these markets considering the S&P 500 returns were well over 10% annually in this time frame. But this isn’t an apples-to-apples comparison.
I don’t think you can legitimately compare real estate to the stock market through performance numbers alone. There are far too many variables to consider — leverage, borrowing costs, fees, expenses, upkeeps, taxes, and the list could go on. There’s no way to do a surface level comparison that holds water. Plus, for the majority of the population, real estate is really a form of consumption, not an investment per se, because you have to live somewhere.
Simply looking at the range of year-over-year gains doesn’t do the real estate bubble justice so here is the growth of a dollar in each of these markets:
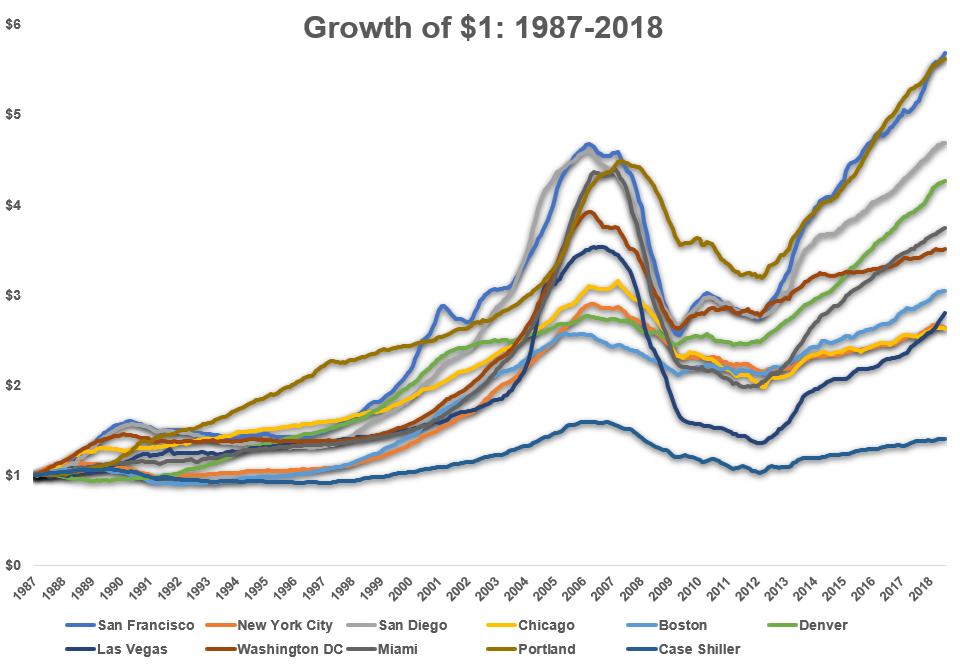
The overall home price index didn’t have nearly the peaks or the valleys some of these metropolitan areas experience but it didn’t have the same gains either.
It’s also worth pointing out how bananas the real estate bubble was. As I said before, the total gains in the Case Shiller index from 1890, when Benjamin Harrison was president, through this year have been 73%, after accounting for inflation, in total. From a minor dip in the real estate market in 1997 through the peak in 2006, the Case Shiller Index was up 75%.
So in a little under 10 years, housing prices were up by more than they have risen in the almost 130-year history of this data set!
But back to our original question — should you wait to buy the dip in real estate?
Based on the historical data there could be ample opportunity to see a drop in prices. It happens more often than most would assume. But I have no idea what sort of signals you would use to try to time this decision, and even if you did, it may not matter for the area or specific house you are targeting. Because there’s so much psychic income involved people make irrational decisions about housing all the time.
Real estate is a complicated asset. Most of us will never be professional real estate investors. Trying to time this market probably sounds like a great idea but the possibility of waiting for a very long time could lead to some serious regret.
The fact that individual markets are so much more volatile than the over real estate market invites more volatile behavior by the participants.
Personally, I would worry more about being able to afford the house you want rather than trying to time the market if you’re not a professional.
Further reading:
Some Thoughts on Investing in Real Estate

