The S&P 500 is up a little less than 1% in 2018 (give or take where it closes today). There’s still a long way to go but if we were to end the year with a plus or minus low single-digit return that would be an outlier. Most years see the stock market give investors double-digit returns, both positive and negative. This piece I wrote for Bloomberg looks back at the historical track record to show why double-digit returns are the norm in the stock market.
*******
U.S. stocks posted their ninth consecutive calendar-year gain in 2017 once you include dividends. The only other time the S&P 500 has advanced for nine straight years on the basis of total returns was in the 1990s, when stocks were positive every year from 1991 to 1999.1
The S&P 500 returned 21.6 percent in 2017. So this also marked the seventh year out of the past nine that it has finished with a double-digit gain.
Gains of this magnitude are sure to make some investors nervous. There have been calls of “too far, too fast” and “the easy money has been made” throughout the current bull market. But double-digit gains are not an outlier in the stock market; they are the norm.
And as you consider 2018, remember that double-digit gains are just as likely.
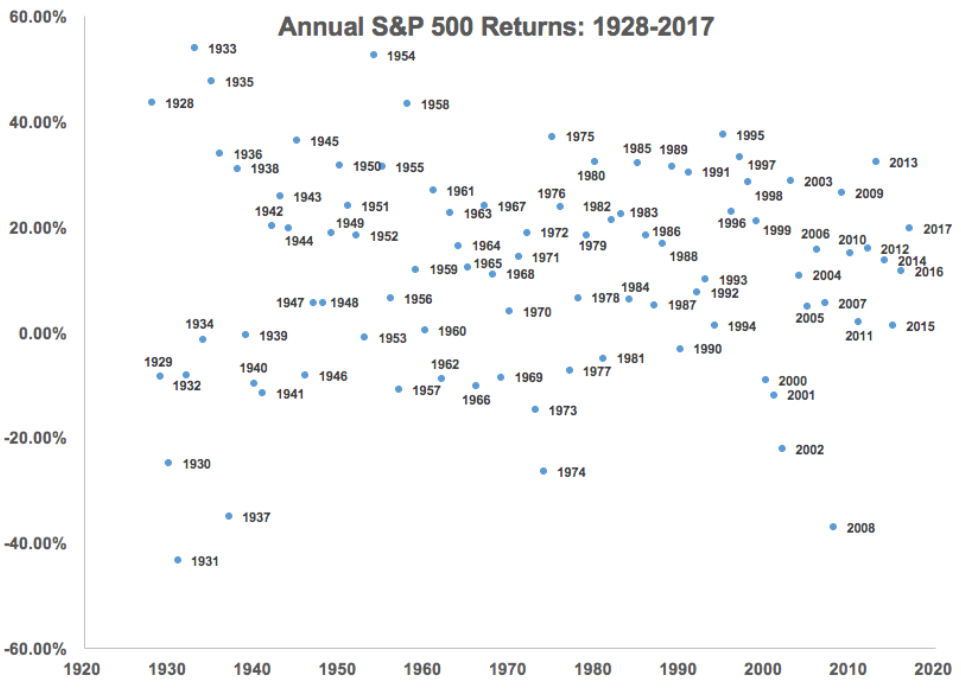
Over the past 90 years, the S&P 500 has shown 66 calendar-year gains and 24 losses. This means stocks have advanced roughly three out of every four years. And in that time, the annualized return was 9.6 percent.
Averages never tell the whole story and calendar-year returns are rarely average in the stock market. Of those 66 positive annual gains, the average return was almost 21 percent. And 51 of those 66 years saw double-digit returns. In fact, the year finished with a gain in the range of 8 percent to 12 percent in just four of the past 90 years, less than 5 percent of the time. Stocks have finished the year with a gain in excess of 20 percent one-third of the time.
A similar pattern appears when stocks fall. The average annual loss during down years was 14 percent. Of the 24 down years, 11 had double-digit drops. On six of those occasions, stocks fell 20 percent or more. When the up and down years are combined, we see that 70 percent of all calendar-year returns are double-digit gains or losses.
The stock market is quite random from year to year, as you can see from the following scatterplot of calendar-year returns since 1928:
There is one aspect of the market that has been somewhat of an outlier in 2017: downside volatility. This year could be remembered as one of the least volatile for the stock market. Going beyond losses from the beginning to the end of the year, we can also look at peak-to-trough losses throughout the year to get a better understanding of the typical up-and-down pattern investors can expect from stocks.
This chart shows the intra-year peak-to-trough drawdown going back to 1950:
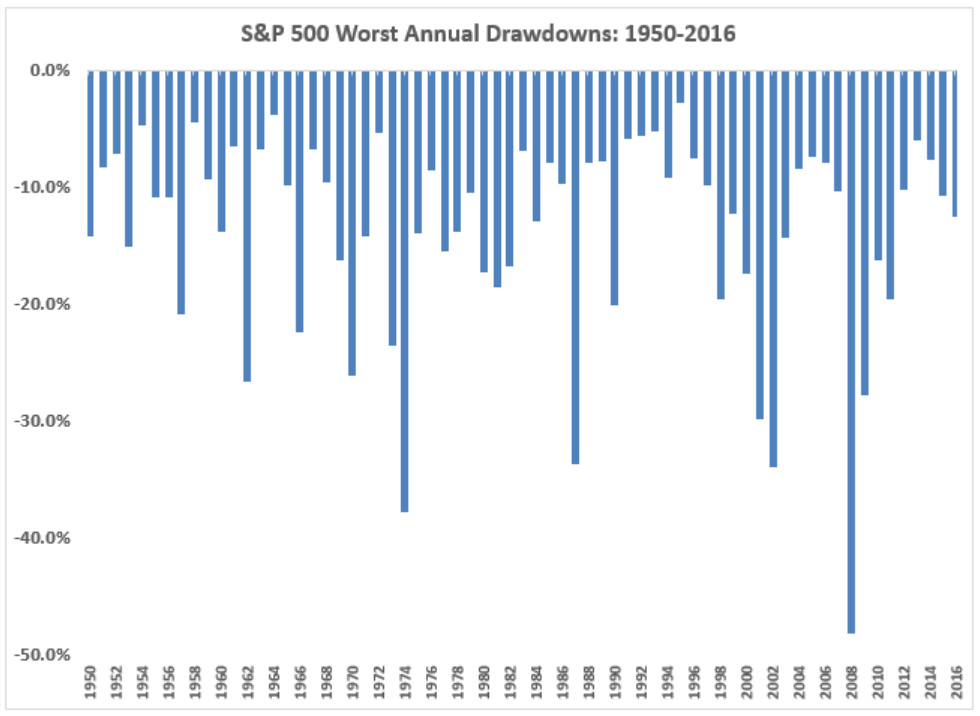
The average intra-year drawdown is a little more than 13 percent, but you can see it varies widely over time. For 2017, the worst drawdown was less than 3 percent, which is the lowest it’s been since the mid-1990s. It’s rare to see a year when the worst loss from a short-term peak is less than 5 percent.
These data show that more than half of all years had a double-digit drawdown at some point, but it also shows how rare it is to see a year when stocks don’t correct at least 5 percent or more. More than 92 percent of all years have experienced a 5 percent correction or worse in this time. Unless we see a sell-off into the end of the year, 2017 will turn out to be an extremely calm one for equity investors.
No one can predict what any single year will bring for the stock market, But this information can be helpful for investors looking at 2018 market outlooks. They can set baselines upon which to build their expectations. Based on the historical data, that baseline is a high probability for double-digit moves in stocks that have little resemblance to the long-term average annual returns.
The only problem for investors is that the average annual gain of 21 percent and the average annual loss of 14 percent offer a wide range to work with. When stocks are up, they tend to be up big, and when stocks are down, look out below.
1The S&P 500 was also up eight years in a row from 1982 to 1989.
Originally published on Bloomberg View in 2018. Reprinted with permission. The opinions expressed are those of the author.
