Investors who dutifully put money into the stock market on a periodic basis over the decade ended in 2009 would have felt dejected when looking at their statements.
If you started dollar cost averaging $500/month into the S&P 500 in January of 2000, by December of 2009 you would have invested $60,000 in total. This strategy would have netted you a whopping $64k and change, not much more than the amount saved. By way of comparison, simply investing that same $500/month in one-month t-bills would have given you more than $67k.
It’s no secret the lost decade of the 2000s was a difficult one for investors considering on a total return basis the S&P 500 was down more than 9% over a ten year period (so averaging in helped a little but not much).
The upside of that lost decade is mean reversion can actually turn into nice reversion (see what I did there?) when things snap back. Had you continued to plug away with that $500/month and stuck with the strategy you would have been handsomely rewarded on the other side.
Through the end of September of this year, the balance would be more than $300k.
The reason I bring up the lost decade in U.S. stocks is because emerging markets are working through their own lost decade(-ish) at the moment. From November of 2007 through September of 2018 the MSCI EM Index is up just 5.5% in total. Over that time the S&P is up nearly 140% while lowly one-month t-bills have risen 4.9%.
Using the same DCA strategy of investing $500/month in EM over this time would have been an investment of $65,500. The ending balance would now be just shy of $85k.1
I played around with the numbers using data from both of these indexes that show why no investor experience is ever average:
Lump sum investing is fairly straightforward. Because of the excessive valuations from the dot-com bubble, returns since 2000 are still well below average for the S&P 500 from that starting point. From January 2000 through September 2018, the annual returns for the S&P 500 were 5.75%. In that same time, emerging markets were up 7% annually. So even with their struggles over the past 10-11 years, EM would have still been the better investment since the turn of the century.
DCA is not so straightforward. Interestingly enough, even though EM showed better annual returns, investing in the S&P would have given you a better result when dollar cost averaging. Using the same January 2000-September 2018 time frame, investing $500/month into each index would have yielded more than $300k in the S&P but just $255k in EM. In this case, the sequence of returns plays a bigger role in determining the outcome than the actual annual returns of the investment option itself.
Volatility is your friend when investing periodically. The sequence of return risk when dollar cost averaging can be illustrated by taking the return streams of the S&P 500 and MSCI EM and simply reversing their order. So instead of starting with January 2000 and ending in September 2018, we start with September 2018 and end with January 2000 to show how the timing of market cycles can impact these results.
This is what I found:
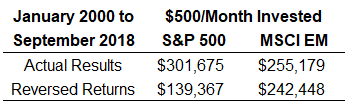
The EM results are fairly similar since both the start and end dates coincided with bear markets but the S&P 500 results are drastically different. In both cases, the compounded returns are still the same — 5.75% and 7%, respectively — but the outcomes are vastly different depending on the timing of the cash flows and the market environment.
If you’re a saver you want low returns (for a while) and volatility. The biggest reason the actual DCA S&P outcome looks better than the sequence of returns scenario is that returns were so poor at the outset and great towards the end. One of the reasons the EM data wasn’t impacted much by reversing the return stream is because those markets are so much more volatile2. Increased volatility offers more opportunities to buy at depressed prices. It also makes it harder to stick with that investment but a combination of low returns in a volatile return stream should be your hope if you’re a saver.
Luck plays a role in these outcomes. Most normal investors don’t average into the markets because they want to but because they have to save bits and pieces out of their paycheck over time. This can make it difficult for investors to fully understand their individual performance. There are plenty of bad investors out there but many simply suffer from bad luck based on when they were born or started saving.
Diversifying over time by dollar cost averaging is a prudent way to manage risk but it won’t always protect you from a bad market environment. This is yet another reason it pays to diversify across asset classes, market capitalizations, and investment strategies.
You just never know when one will do better than the others.
Further Reading:
Mean Reversion From the Lost Decade
1I’m not taking account costs into these calculations because it’s taken off the actual indexes but close enough.
2Emerging markets volatility was 50% higher than the S&P in this time (21% to 14%).
