Time for another round of reader questions. Feel free to reach out with any feedback or questions and I’ll try to do this once a month or so if people are interested.
Q. Do you have any advice in regards to technical skills that aspiring analyst should try and acquire that may add incremental value to a financial analysis (importantly value investing)? Or is proficiency in Excel sufficient (building models, etc.) and one should focus more on increasing ability to convey ideas and stock pitches? I am just worried big data is the ‘new’ thing, and will become more of a necessity for analysts to start incorporating deeper dive into data to produce meaningful analysis.
I remember my first internship in the investment industry for a sell side analyst. On the first day he showed me his enormous collection of Excel models that had spreadsheet tabs as far as the eye could see. It took him months and months of work to build them and I was constantly helping him update the numbers and formulas. They were insanely impressive.
But I quickly realized that every other analyst at the firm had similar models for their companies as did all of the analysts at the other firms. And even though these models were optimized down to the most minute details, there were always just a few numbers that really moved the needle for the outputs they were looking for. All of these models are garbage-in, garbage-out.
So, sure, technical skills are an important first step, but it’s really the critical thinking and analysis that matters. You have to be able to translate those models into actionable advice or analysis. Communication skills are also really important when you’re just getting started because you have to try much harder to convince others to listen to your ideas when you’re the low person on the totem pole.
Q. I had a quick question re your latest piece on John Bogle’s future return formula. Have you done anything to assemble a similar view for international developed and/or EM?
As a reminder, the John Bogle expected return formula = dividend yield + earnings growth +/- change in valuations. Here’s a quick comparison of U.S. and international markets using some broad ETFs as proxies:

The first input in the formula obviously favors international markets as they all have higher yields. Earnings growth could certainly impact the return outcomes going forward but my guess would be the valuation differences will be the true differentiator when all is said and done. These markets are structured differently in terms of sectors and such but foreign markets are obviously cheaper than U.S. stocks (which would make sense given the U.S. outperformance in recent years).
Bogle is not a huge fan of investing internationally, but it looks like his expected return formula would say foreign shares are much more attractive that U.S. stocks.
Q. What does the relative market cap of Ford and Tesla says about the market’s ability to determine the value of companies?
This is a great question. Here’s the quick breakdown on a few basic metrics for each company:

At first glance these market caps make no sense in comparison to the sales and earnings numbers. What this really comes down to is fundamentals versus expectations. In a recent podcast with Patrick O’Shaughnessy, Michael Mauboussin said the biggest mistake he sees from stock pickers is a failure to distinguish between fundamentals and expectations.
He gave the analogy of the high jump. The expectations are where the bar is set and the fundamentals are how high the company will jump. Expectations might be too high if the bar is set at 2 feet but you can only jump a foot. And if the bar is set much higher at 8 feet and you can jump 10 feet you can outperform as a company. Judging by these metrics it would appear Ford has a 2 foot bar while Tesla is trying to clear 8 feet.
So what really matters here is whether or not Tesla can outperform their sky high expectations. I’m not smart enough to answer that, but these are the kinds of questions that make markets interesting.
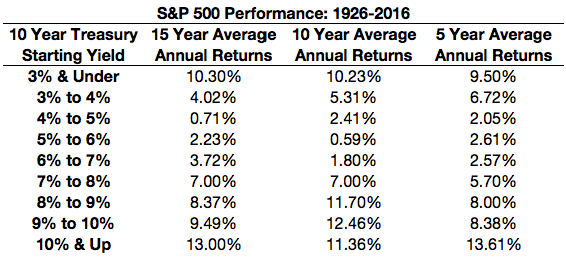
Q. High rates typically yield better stock market returns in nominal terms — how does this look in real after inflation measures?
This question was in reference to a post earlier this week on interest rate levels and future stock market returns (see: How Interest Rates Affect Stock Market Returns). I showed the returns nominally so a few people asked to see the same thing on a real basis. Here are those numbers updated to include the affects of inflation:

It’s interesting that the relationships still hold up even after accounting for inflation. But I should also add that the sample size of each could have an affect here too. For example, rates were only above 8% around 15% of the time since 1926, but they were below 5% more than 60% of the time. So lower rates have been much more prevalent historically than higher rates.
Plus you have the fact there have been very few interest rate regimes in this time. Rates were low from the 1920s to the 1950s until steadily rising through the 1970s and peaking in the early 1980s and falling ever since. All of which is to say – any time you’re looking at this type of data is makes sense to put things into context.
Have a nice weekend.
Further Reading:
A Short History of Interest Rates
