My colleague Michael Batnick wrote a great piece last week that illustrates why investing in the stock market can be so challenging. I encourage you to read the entire piece, but there was one really eye-catching statistic he shared that I wanted to highlight. This chart shows the growth of $1 in the S&P 500, after accounting for the effects of inflation, over various market cycles:
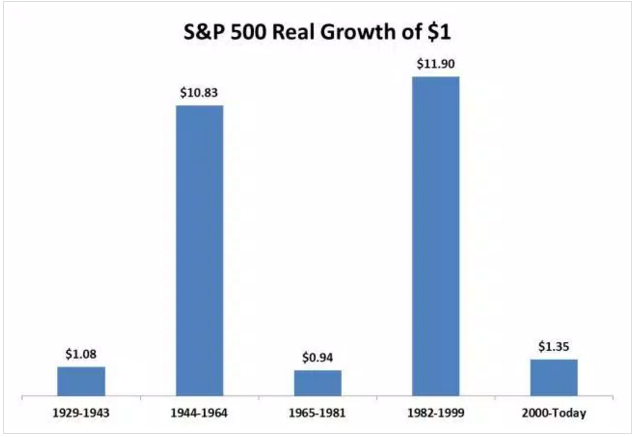
Long periods with little progress on a real basis show why investing in stocks can be so frustrating. In a follow-up conversation I asked Michael if he thought that diversification could have provided some support during the poor market cycles. He ran some numbers for me to show the same growth in $1 over these various time frames for small cap stocks, small cap value stocks, large cap value stocks, treasuries and corporate bonds in addition to the S&P 500. These are the results:
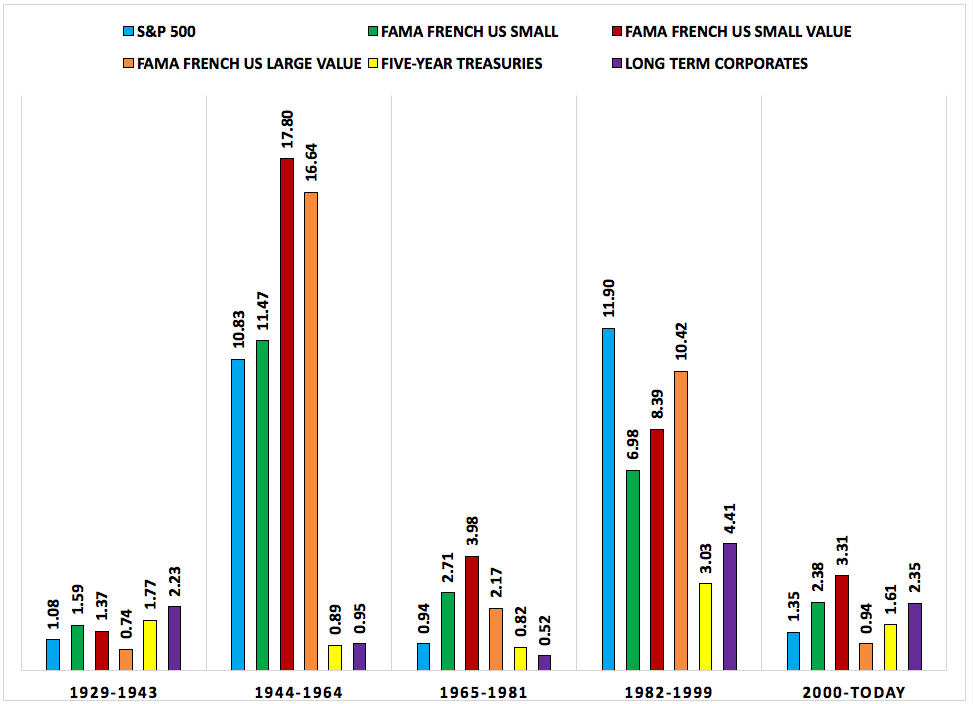
The Great Depression and its aftermath was probably the most difficult period ever in the markets. Still, if you were to take the average of these six assets classes, the growth of $1 still grew to $1.46. Not bad considering the circumstances. The ensuing period saw very low interest rates, which meant that the stock market carried the day for a diversified portfolio. The average growth of $1 in the 1944-1964 period came out to $9.76.
The biggest reason for the poor real returns in the 1965-1981 period came from the higher than average inflation rate. On a nominal basis the returns weren’t quite as bad as they may appear here. Still, adding small caps and value stocks would have helped — $1 grew to $1.86 for the group. It would have been fairly difficult to not make money in the 1982-1999 bull market as these six asset classes would have turned $1 into $7.52 over 18 years. Finally, the most recent period has been unkind to the S&P 500 as it’s been cut in half twice since the year 2000. Even with the two recessions and multitude of other problems in this time a diversified portfolio in these asset classes would have doubled your money.
Now here’s what the S&P 500 looks like against an average of all of the assets listed in the second chart:
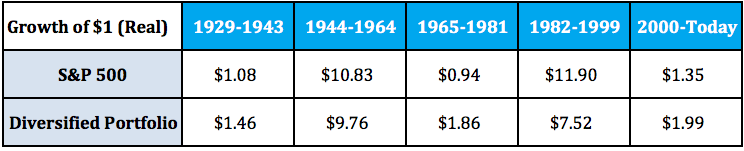
There were still periods of above and below-average performance. But there were never any long stretches that ended in a loss of purchasing power, which wasn’t the case for the S&P 500. In fact, except for the out-of-this-world bull market in the 80s and 90s, each of these cycles contained at least one asset that failed to beat the rate of inflation, yet the overall real returns were still positive.
Diversification isn’t perfect. It doesn’t always work over the short-term and there’s always going to be something that you hate holding onto.
But over longer time frames it remains one of the best forms of risk management that an investor can practice.
Read the rest of Michael’s piece here:
You Are Owed Nothing (Irrelevant Investor)
Further Reading:
Was the 1966-1982 Stock Market Really That Bad?
