“If money isn’t loosened up, this sucker could go down.” George W. Bush
If you had the misfortune of buying an S&P 500 index fund the Friday before Lehman Brothers went bankrupt you would’ve lost 46% over the next 6 months or so.
On the other hand, if you bought that day but never sold you’re up around 185% in total.
Both of these stats are mind-boggling but still don’t tell the entire story.
I’m not usually one to pay attention to specific market anniversaries because there’s nothing special about round numbers. But the 10 year anniversary of the Lehman Brothers collapse has me reminiscing.
I was a little over a year into my new job working in the investment office for a relatively new nonprofit endowment fund. I’d been spending my time outside of work going back and forth between studying for the CFA exam and reading books about market history.
Neither of these activities prepared me for what took place in the fall of 2008.
It was scary. It was chaos. It was madness. And it was one of the best things that could have happened to someone like me who was just 5 years or so into the industry.
Fund managers were telling us to take out as much cash from the bank as we could heading into the weekend (crazy things seemed to always happen on the weekends). Our peers in the endowments and foundations world were scrambling to shore up their cash reserves because so many of their holdings were illiquid. Even cash management was an issue as investors were selling anything that wasn’t a short-term U.S. Treasury bond.
Witnessing such an unbelievable recovery since that time makes it almost impossible to believe the turmoil market went through in the fall of 2008. Just take a look at these returns for September and October of 2008 in a variety of asset classes:
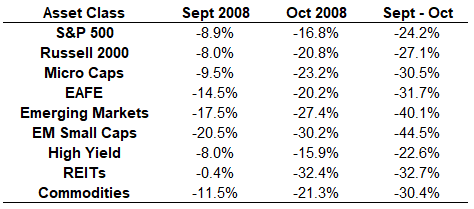
The severity of these losses is hard to comprehend. No one knew what to do after this seismic wave hit. Most of the money managers we used sold their stocks and raised an inordinate amount of cash, in the 50-75% range for most of them by the time the dust settled.
Even though this was wildly outside of their investment mandates, no one really questioned it because no one had a clue what was going to happen next.
Buffett wrote his Buy American I Am piece for the New York Times on October 16, 2008. The market rallied for a couple days but even the Oracle couldn’t calm investor’s nerves.
I used monthly returns the above table but the daily experience in the stock market was even more brutal because the volatility in both directions was insane.
In September and October alone, there were 20 days in which the S&P 500 was down 1% or worse. There were 15 trading days with losses in excess of 2% and 5 days which saw stocks drop 5% or more. In that same time, there were actually 14 days that were up 1% or more, 9 days where stocks rose 2% or better, and 3 days when the S&P was up more than 5%.
This means 34 of the 42 trading days in September and October of 2008 saw gains or losses exceed 1%. There were 24 days of plus or minus 2%. So 80% of all trading days were +/- 1% and nearly 60% of all trading days were +/- 2%.
The S&P experienced daily losses of -9.0%, -8.8%, -7.6%, -6.1% and -5.7%. It also saw daily gains of +5.4%, +10.8% and +11.6%.1 2008 was unbelievably volatile.
As we now know, the dust didn’t settle for long after that initial wave of selling. November saw continued losses, and after a short reprieve in December, things continued to go from bad to worse in the first couple months of 2009:
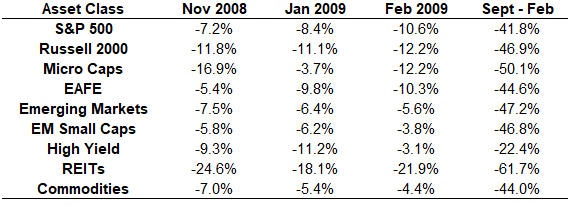
The bear market technically lasted from the peak in October 2007 until the market bottomed on March 9, 2009, but the bulk of the selling came in a compressed 6 month period.
It offered little comfort at the time, but high-quality bonds held up quite well in this period. Long-term treasuries and 5-year notes were both slightly positive in September of 2008 (+1.1% and +0.8%, respectively).
Surprisingly, long-term bonds sold off in October, falling 3.8%, but that was reversed and then some the next month as they rose nearly 15%. From September through the end of February, long-term bonds were up almost 8% while 5-year bonds rose almost 6%.
Correlations in risk assets tend to go to one during a crash but bonds did their job in what could be the worst crash of my generation. Bonds were basically your only non-hedged form of safety during the market crash.
It’s difficult to offer sweeping generalizations from the financial crisis because that period of time affected different people in different ways.
A lot of investors had their brain broken by the financial crisis and will spend their days predicting the next big one at all times. Others probably learned the wrong lessons or have completely forgotten everything they should have learned.
My single biggest takeaway is that anything is possible in the markets. Panics are real and no one knows how or why they will end.
Further Reading:
9 Lessons From the Great Depression
1This is a perfect example of volatility clustering in a bear market. The best and the worst days tend to come when investors are panicking.
