A reader asks:
I’ve heard Ben mention several times recently that we are in year 15 of a bull market. He’s obviously referencing the end of the GFC in 2009 as the start of the current market cycle. Have we not had two bear markets in 2020 and 2022 (defined as -20% from the high)? When you had Tom Lee on last year (TCAF) he said 2024 was going to be year 2 of a bull, so he’s got a different definition. Can you please explain what people in the finance community use to define ends/beginnings of cyclical markets?
Here’s the chart in question from a recent blog post:
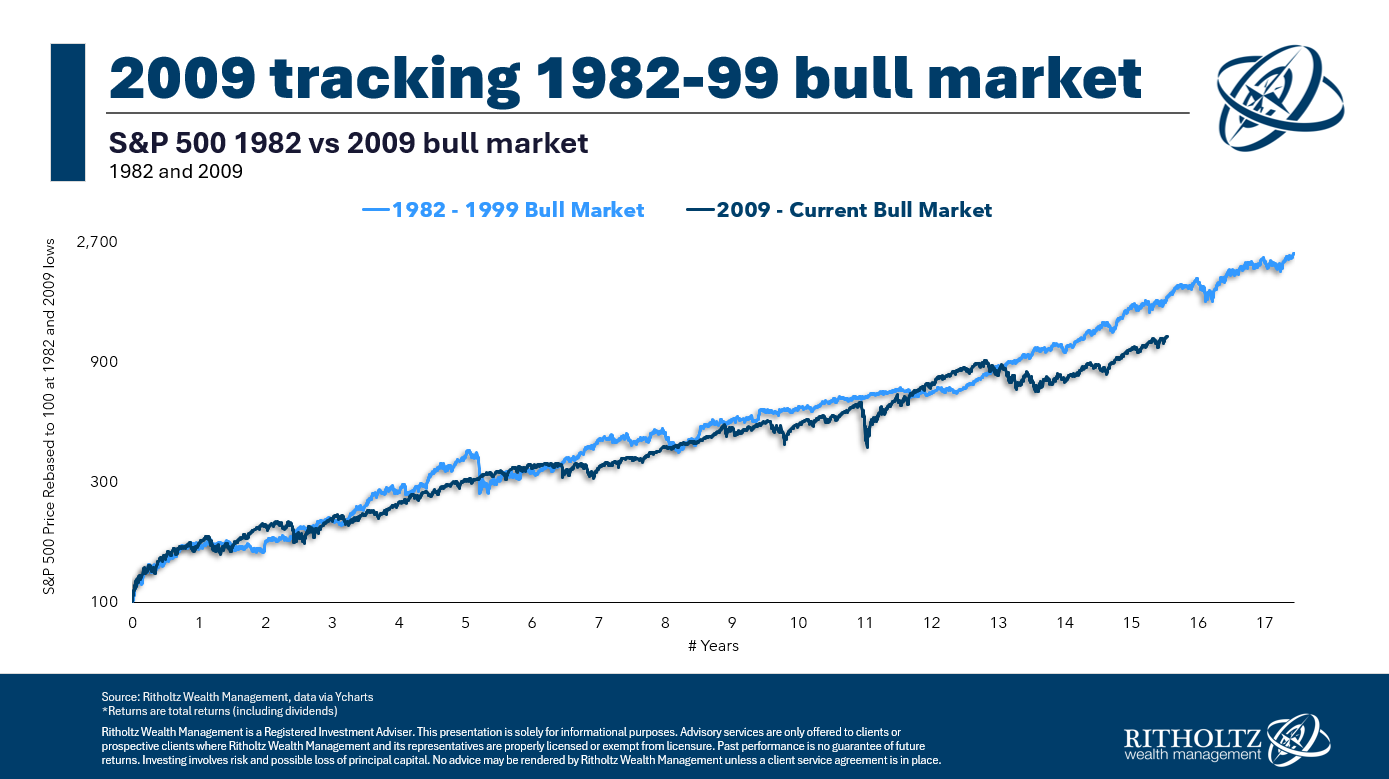
Did the bull market from 2009 get reset in 2020 or 2022? Or should we keep it going just like we did with the 1987 crash during that bull market?
The problem is these things aren’t exactly scientific.
There are some loosely accepted definitions but you have secular bull and bear markets as well as cyclical bull and bear markets. Things can get murky since different investors have different rules when it comes to hitting the reset button and starting over.
One standard definition is a loss of 20% or more means the start of a bear market and end of a bull market, at least on a cyclical basis.
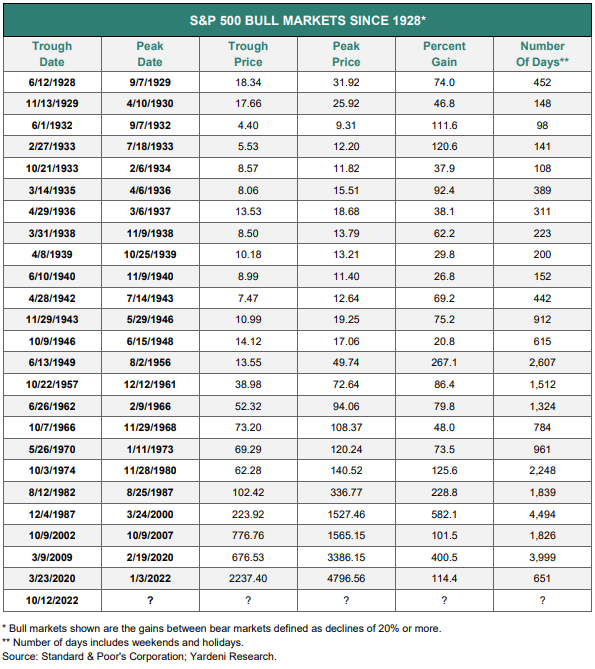
Yardeni Research publishes some handy historical bull and bear market tables1 going back to the 1920s. Here’s the bull market table:
And the bear markets:
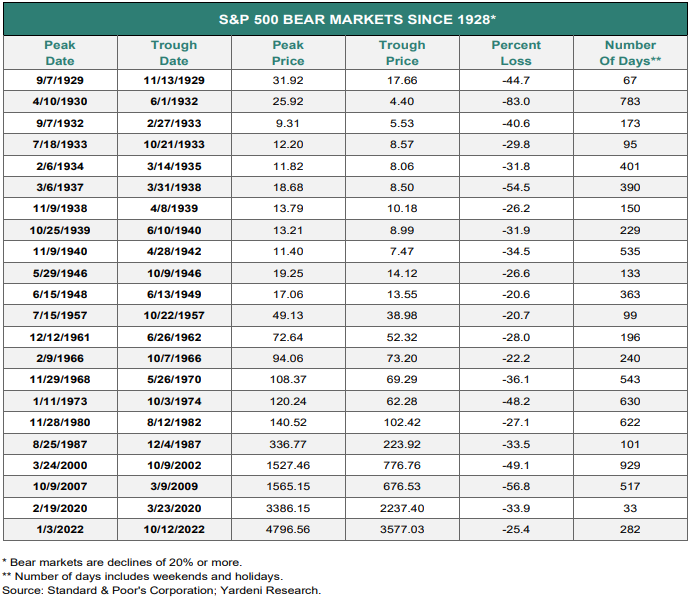
You can see there are plenty of both bull and bear markets.
Here’s a chart we created that allows you to visualize these cycles:
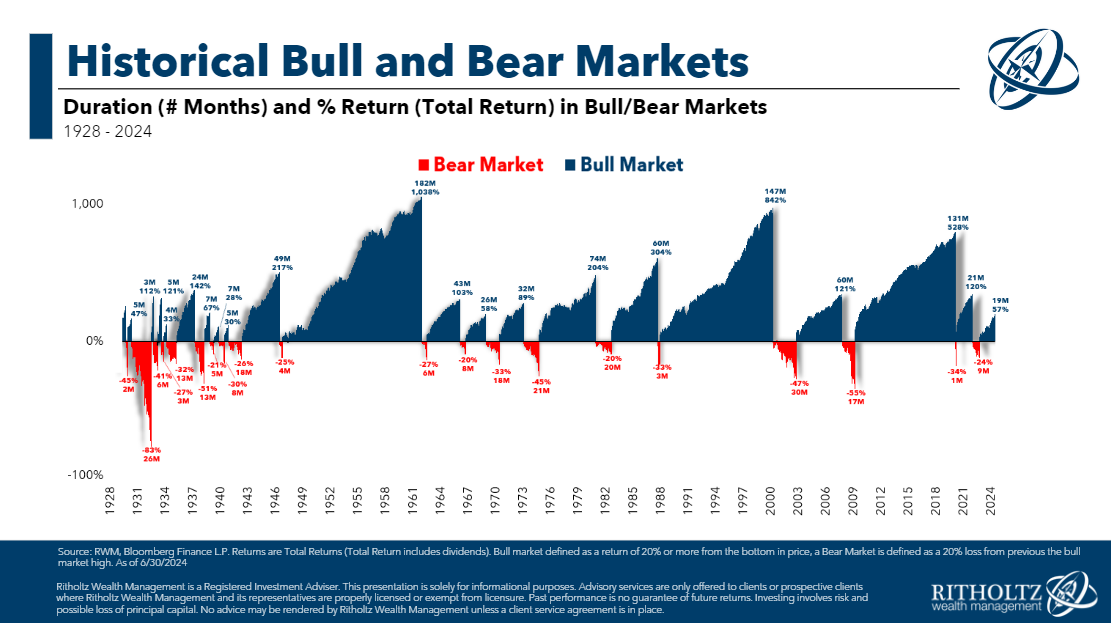
It is important to recognize that using this 20% definition puts many of these bull and bear markets in the cyclical stage.
The problem is many of them were just countertrend rallies or downturns within the context of a broader long-term uptrend or downtrend.
For example, there was a cyclical bull market from the end of 1929 through early 1930 when stocks rose ~50%. The Great Depression crash didn’t technically bottom until 1932. No one looks back at that dead cat bounce as a bull market. It was a minor reprieve during a massive downturn.
The 1987 crash was the opposite. No one really thinks the 1980s bull market ended in 1987. That was a countertrend crash but the bull market charged higher for many years after that.
The Covid crash was our 1987 moment. And the 2022 bear market was run-of-the-mill not some giant financial crisis that altered the secular uptrend.
Take a look at my version of secular bull and bear markets:
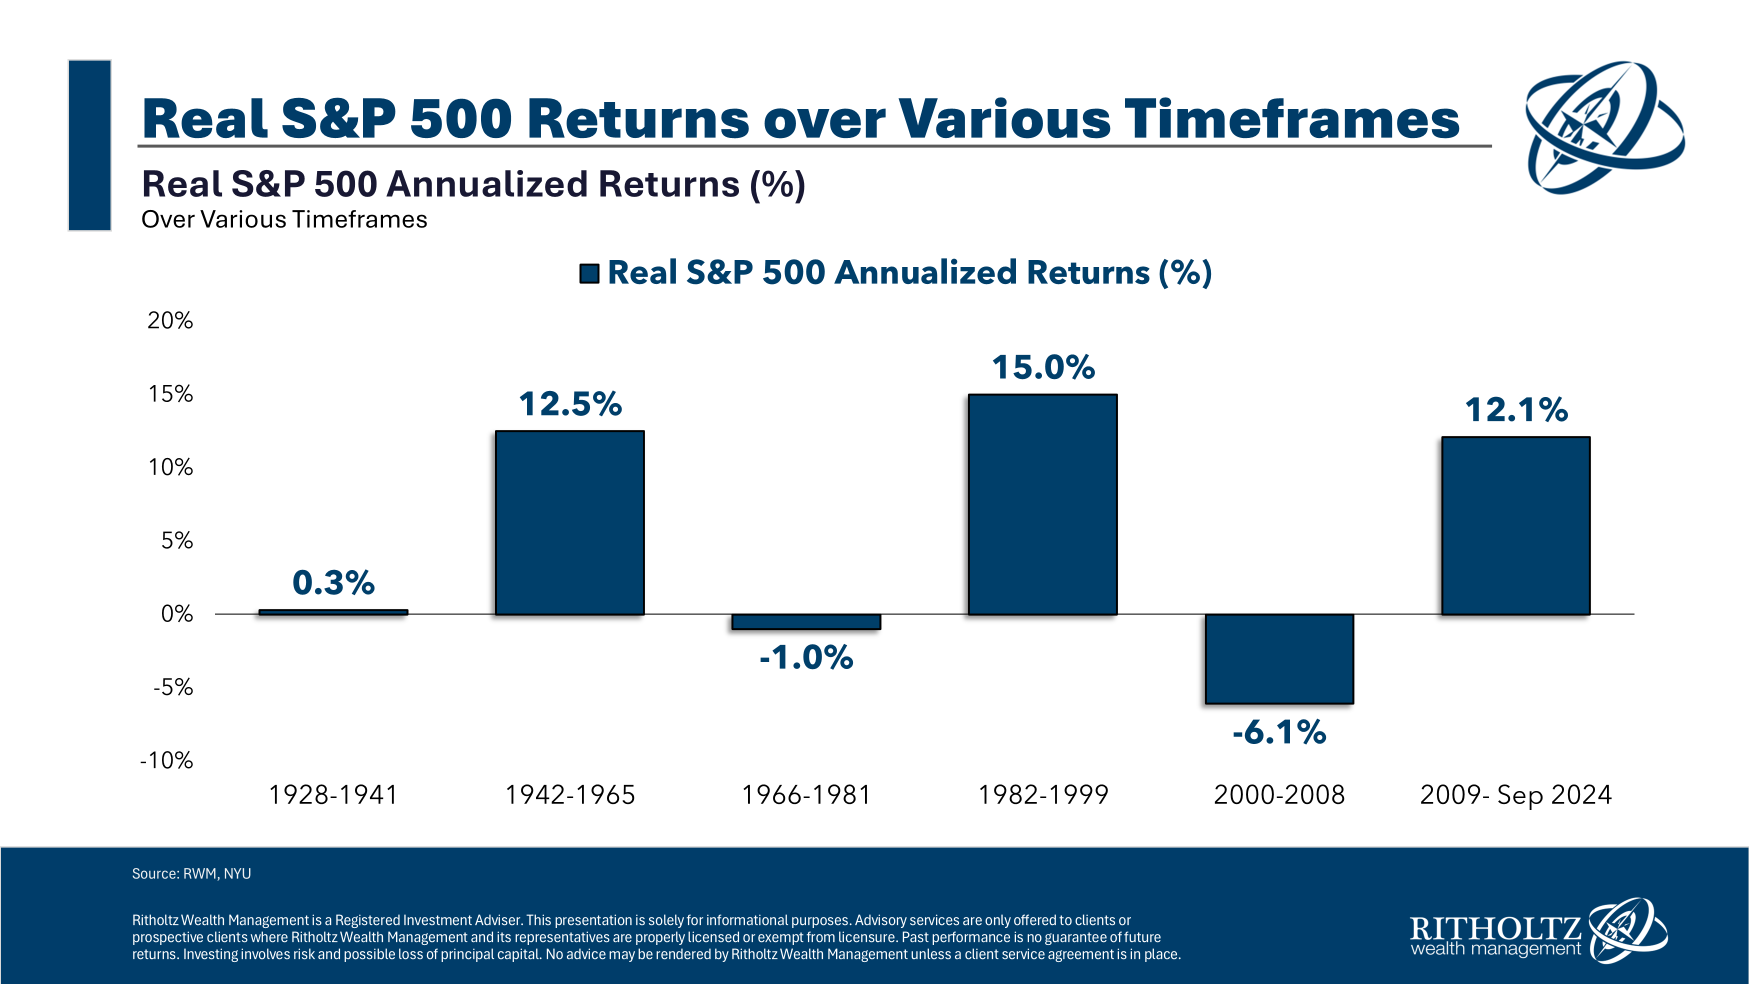
So while there are 20+ cyclical bull and bear markets over the past 100 years or so, there have really only been six secular longer-term periods.
The extended secular bull market from 1942-1965 is a good example of why you can’t call an end to a long-term bull market just because stocks were in a technical bear market. In this time frame, the S&P 500 was up almost 13% after accounting for inflation, but there were setbacks along the way.
I count four bear markets:
- 1946 -26.6%
- 1948-1949 -20.6%
- 1957 -20.7%
- 1961-1962 -28.0%
There is a difference between a bear market and a crash.
There have also been a handful of 19% and change corrections over time. I count four since the mid-1970s — in 1976-1978 (-19.4%), 1990 (-19.9%), 2011 (-19.4%) and 2018 (-19.8%). If we’re being generous we could round those up. It’s not like a 20% loss feels any worse than a 19% loss.
The one big difference between the current run and previous versions is that this secular bull market started at the very bottom of an earth-shattering bear market, which wasn’t the case in previous bull runs.
The stock market bottomed in 1932 but the bull market didn’t start until 1942.
The stock market bottomed in 1974 but the bull market didn’t start until 1982.
This time around the stock market bottomed in 2009 and the bull market started immediately. There was no sideways move following the Great Financial Crisis, just a giant V-shaped recovery.
What changed?
Basically, we now get bazookas fired by the government and the Fed. Monetary and fiscal policy are used during financial crises on a scale we’ve never seen before. During the Great Depression, the Fed and government worsened the situation by tightening spending and Fed policy.
We’ve learned our lessons from the past.
I’m not saying we can’t have extended bear markets anymore. We can and will.
But the addition of fiscal and monetary stimulus during the worst downturns means the snapbacks will likely come quicker than they did in the past (assuming that stimulus doesn’t go away).
Is this entire conversation a bit of semantics?
Yes.
But so are most historical stock market conversations because markets don’t operate like physics. Most of the time we can’t define these things until after the fact.
And that’s what makes them interesting to argue about.
There are no scientific relationships in the markets so we have to make stuff up as we go.
We discussed this question on the latest edition of Ask the Compound:
Nick Maggiulli joined me on the show this week to tackle questions about investing in total stock market index funds, how to value your pension, factors that allow you to take more risk in your portfolio and when to sell your big winners.
Further Reading:
An Epic Bull Market
1It’s worth noting these are price returns only, no dividends included.
