Each year the Bureau of Labor Statistics (BLS) updates consumer expenditure data on how Americans collectively spend and earn their money.
These numbers are averages so your personal household budget probably looks different in some ways. Your circumstances — where you live, your standard of living, how much you make, family situation, etc. — often dictate how you spend.
But it can be instructive to look at aggregate spending numbers to see where the most dollars go:
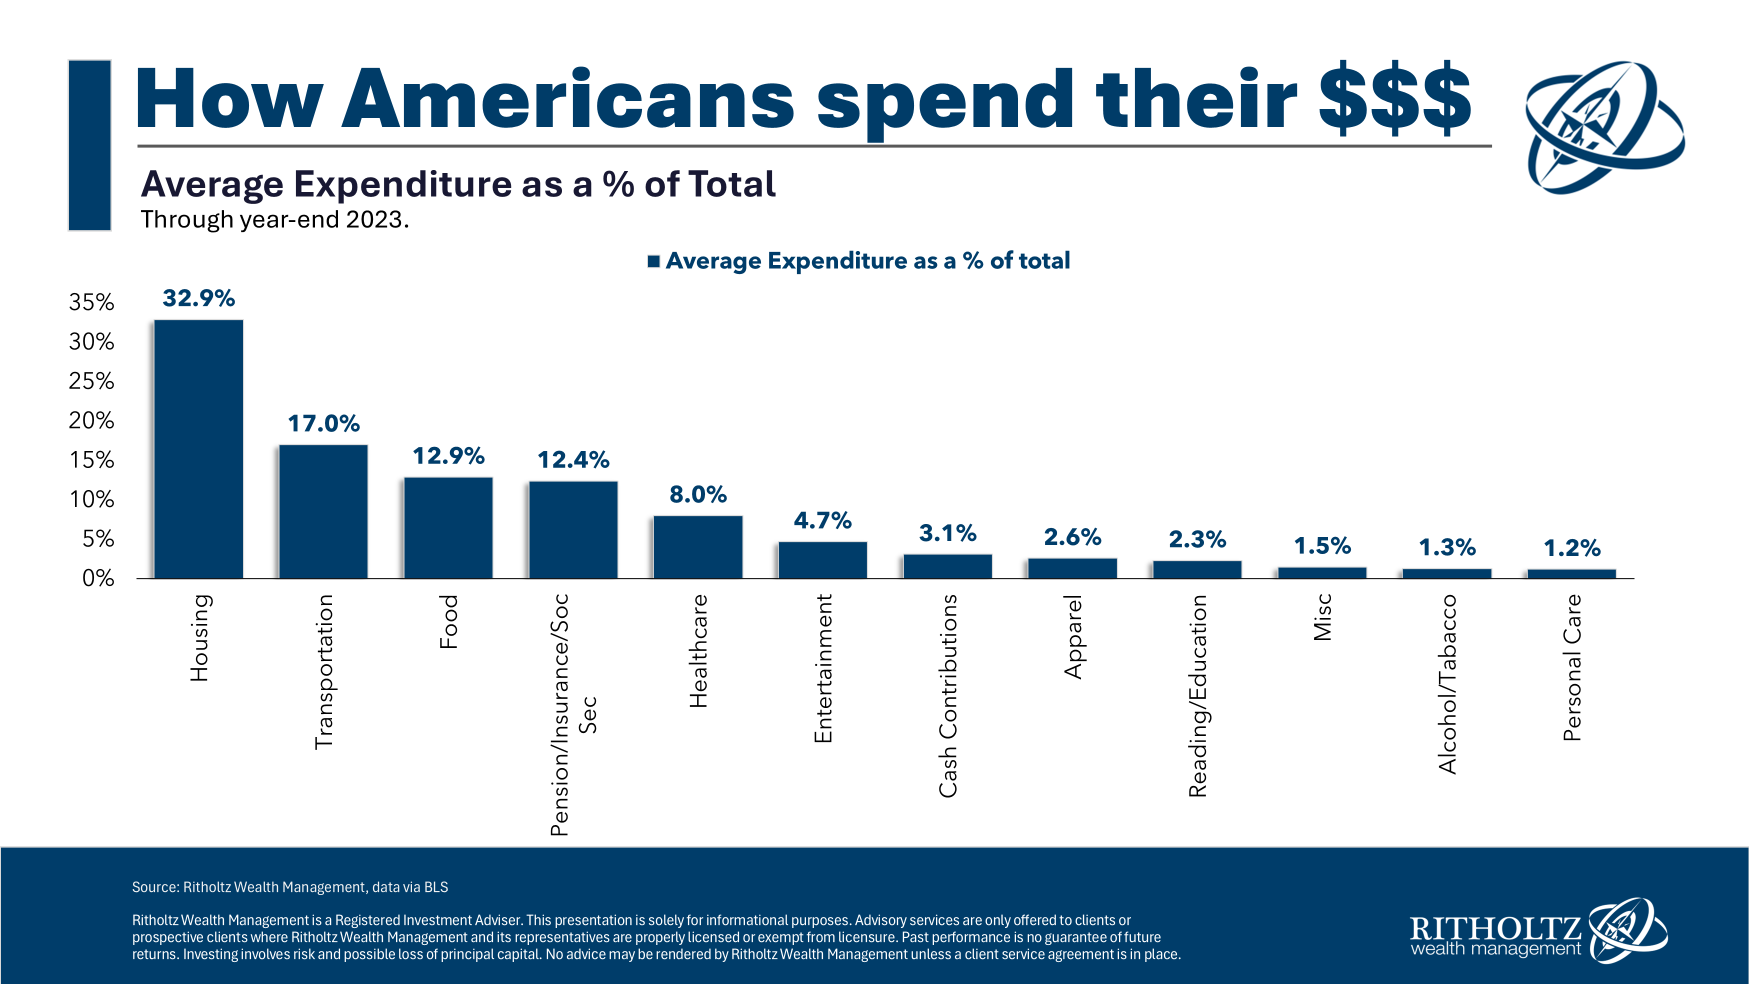
People pay a lot of attention to gas and grocery prices but housing and transportation costs make up 50% of all household spending, on average. Add in food and now we’re close to two-thirds of household spending on necessities.1
It’s the big things that matter when it comes to budgeting. Your daily Starbucks addiction isn’t going to move the needle nearly as much as getting your housing and transportation costs right.
Housing is the big one, of course, but it’s a tough one to pin down on the inflation front. If you locked in a 3% mortgage rate during the pandemic you’ve likely experienced deflation in your housing costs in recent years. Yes insurance and property taxes can rise but that’s a completely different situation than someone trying to buy a house today at much higher prices and mortgage rates.
Renters don’t pay the ancillary costs of home ownership but inflation for the renter class has been a bigger burden in recent years than for homeowners.
Right or wrong, much of the housing inflation this decade has boiled down to luck, both good and bad.
Transportation costs, on the other hand, are more about choice than luck. The all-in costs for transportation — vehicle cost, insurance, maintenance, gas, etc. — were up more than 7% in 2023 after rising more than 12% in 2022.
Much of this has to do with the general rise in prices during this time but some of the transportation costs over time feel like self-imposed inflation.
Look at this chart from Bank of America that shows the changing nature of vehicle consumption over time:
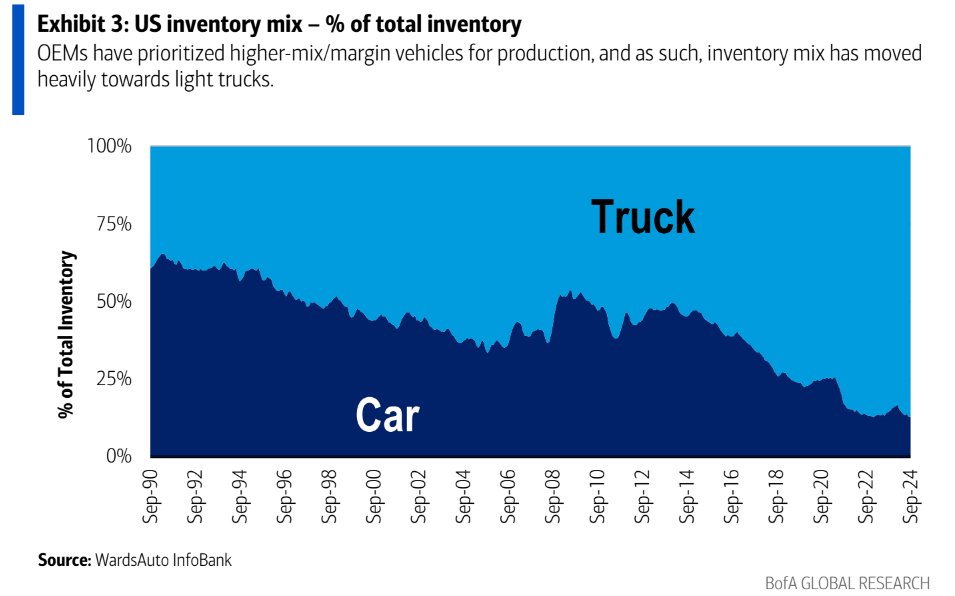
Two-thirds of all vehicles on the road in the early-1990s were cars. As recently as 2010, it was basically 50/50. Now we’re looking at 85% of the inventory mix in trucks and SUVs.
We love trucks and SUVs in this country but this shift has to have made a dent in household budgets over time.
Vehicles get better gas milage today than they did in the past but households could save money on gas, insurance premiums and monthly payments if they switched from a truck or SUV back to a sedan.
The crazy thing is our vehicles are getting bigger while our families are getting smaller. The average family size 100 years ago was roughly 4.5 while today it’s more like 2.5. I still don’t understand how people got around in the past when families often had 4-5 kids.
To be fair, I am a hypocrite on this topic. We are a two-SUV family (we also have 3 kids).2
If your budget is stretched, there are really only two places to look for the biggest savings — housing and transportation.
Transportation seems like the simplest fix for most people.
If you need more money, drive something smaller and cheaper.
Further Reading:
Is Auto Insurance Becoming a Crisis?
1Not all food spending is out of necessity. Nearly 40% of food spending is classified as “away from home” meaning eating out. Inflation is much higher for eating out than eating at home. Over the past 10 years, food away from home inflation is nearly 50% versus 35% for food at home prices.
2When we’re empty-nesters in ~10 years I can’t wait to drive a sedan again. I miss it.
