Hendrik Bessembinder has produced some of my favorite stock market research.
Bessembinder discovered that four out of every seven stocks in the U.S. have underperformed cash (one-month T-bills) since 1926. And just 4% of companies accounted for all the wealth gains for the entire stock market in that time.
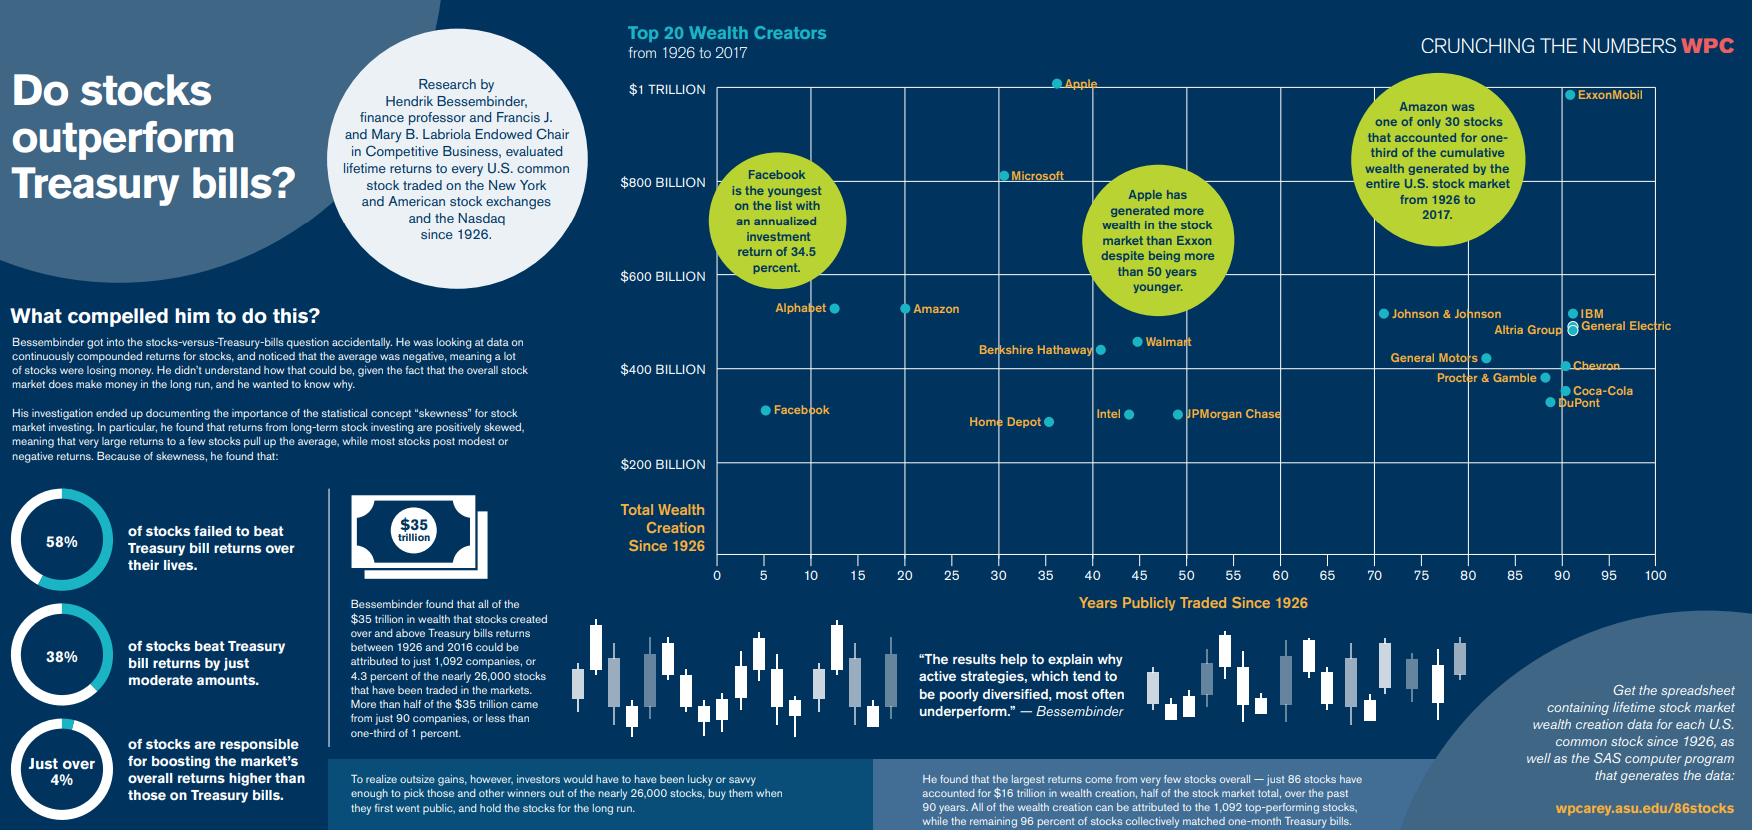
The stock market runs on power laws over the long run.
Of course, there are stocks that do well over short time frames, but Bessembinder’s research highlights the benefits of diversification to ensure you take part in those big winners over time.
In a newly released research paper, Bessembinder goes deeper into the individual stocks that have experienced the biggest gains in market history.
This was the stat that stuck out to me the most from this research:
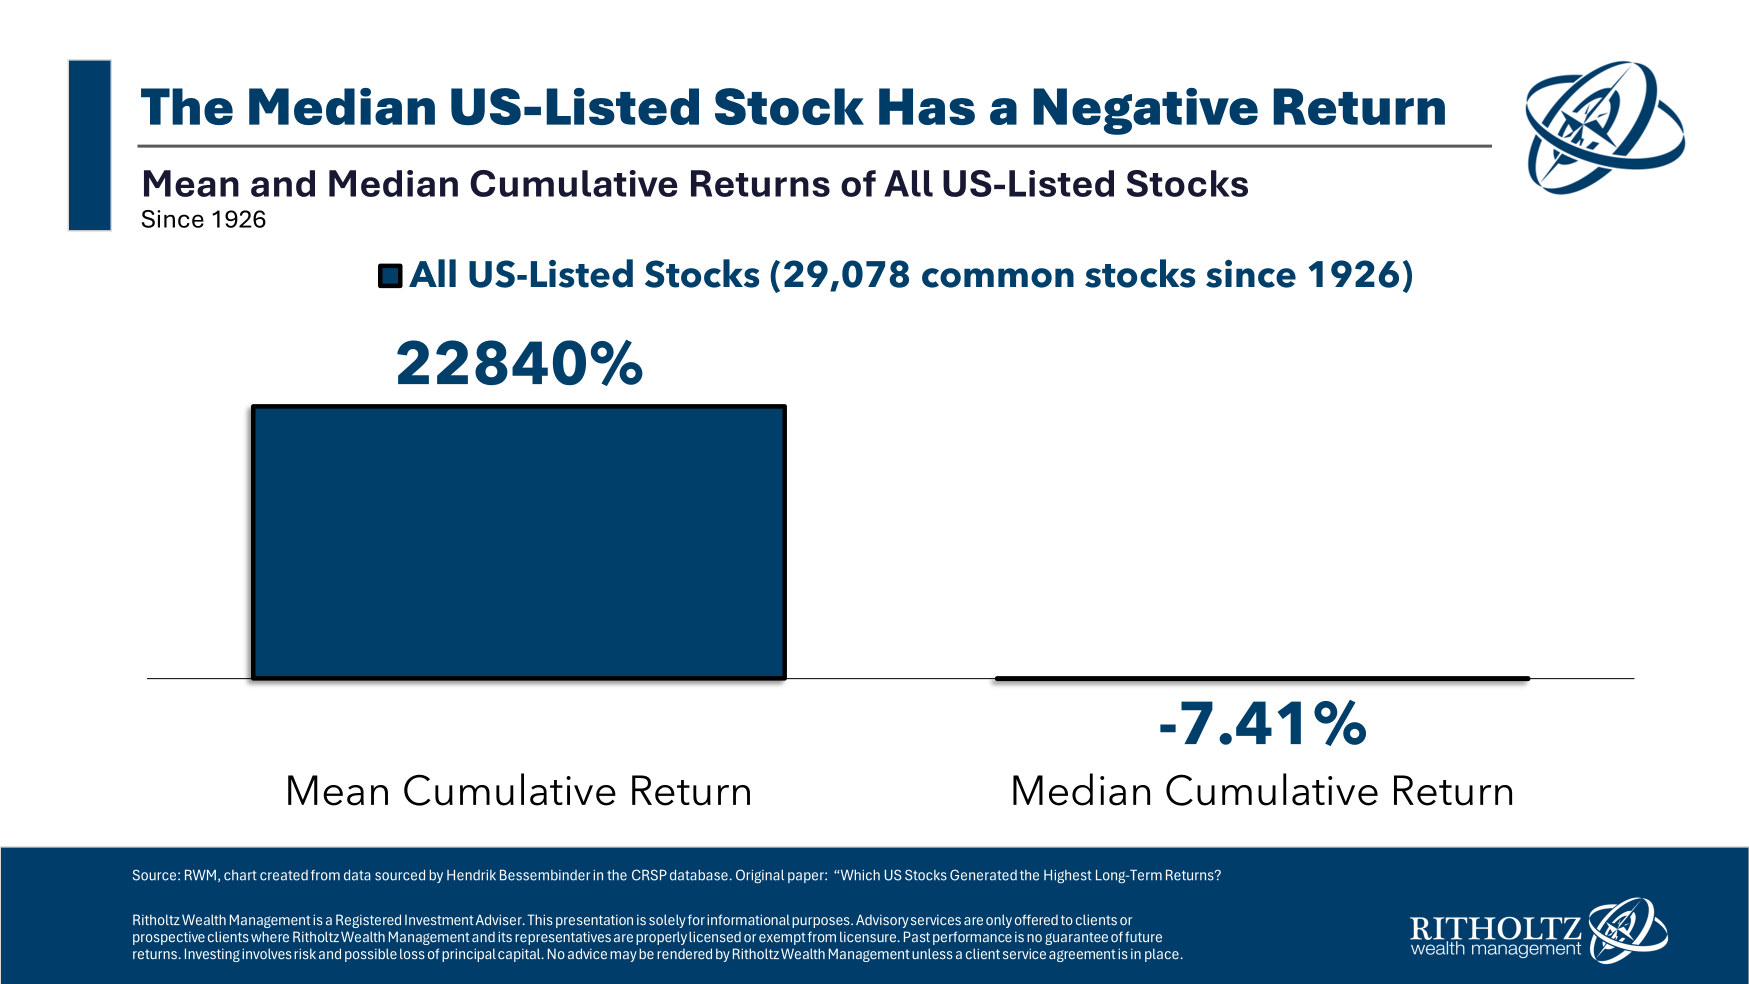
The average cumulative return going back to 1926 was nearly 23,000%, just a gargantuan number. But the median stock in that time experienced a cumulative return of -7.4%.
That’s a massive spread.
Remember, the median is simply the middle number of a group, which means more than half of all stocks have experienced negative returns.
The fact that the average return is so high reinforces Bessembinder’s earlier work about the *jargon alert* positive skew in the stock market. This tells you the best-performing stocks have experienced outsized returns relative to the rest of the market.
Most stocks are crap over the very long-run but the biggest gainers more than make up for the losers.
Some more data that stood out:
- 17 stocks had cumulative returns of more than 5 million percent.
- The annual returns of these mega-winners were lower than you would expect, with an average of 13.5% annualized. Time in the market, etc, etc.
- Altria was the best-performing stock over the entire period, with annual returns of 16.3% from 1926 to 2023.
- Nvidia had the highest annualized return of any stock with at least 20 years of data at 33.4% per year.
- Just 38 stocks survived the entire 98 year period studied.
Here’s a look at the biggest winners over the long haul:
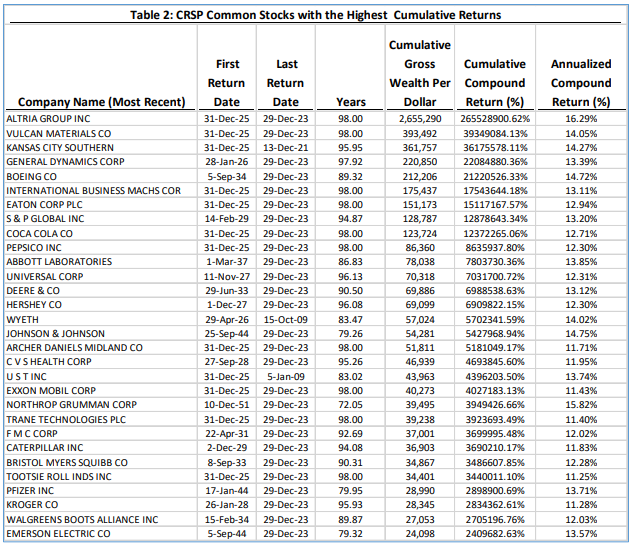
There are some surprises on the list, but mostly blue chip names, which I suppose is how they became blue chips in the first place.
Now for some takeaways:
Index funds are hard to beat for a reason. The SPIVA annual scorecard provides a nice proof of concept for Bessembinder’s data:
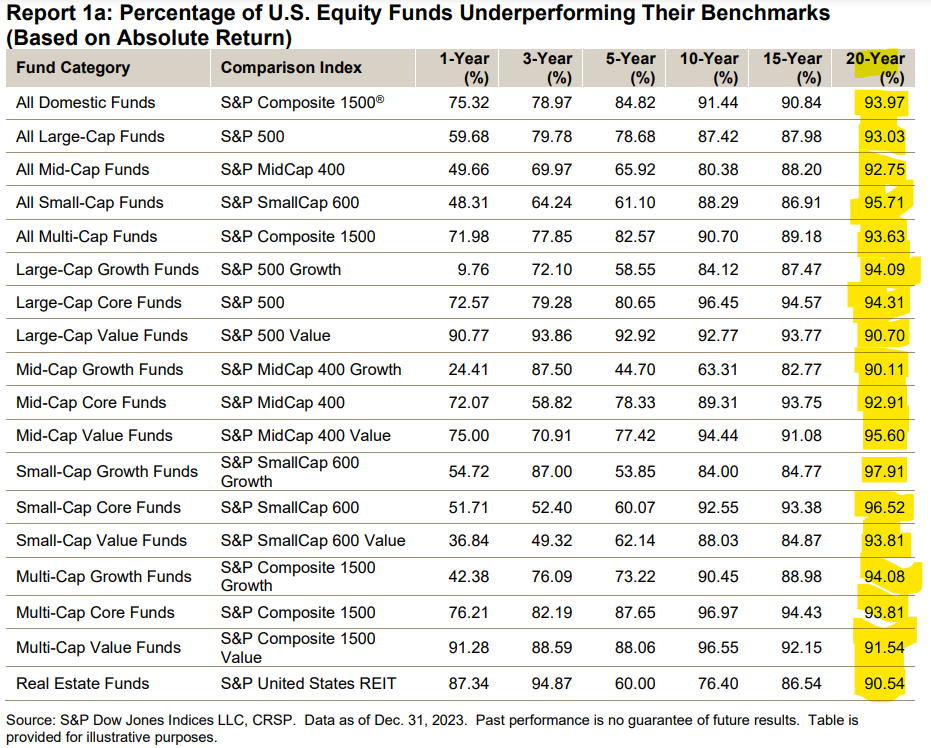
The stock market is hard to beat because picking the winning stocks is hard. Index funds own them regardless.
Winners > losers. Index funds also own the losers, of which there are many.
But the winners more than make up for the losers.
That’s the beauty of the stock market.
Compounding over decade-long periods is like magic. There are no stocks for the long run with crazy 20% or 30% annual returns over 8-9 decades.
From 1926-2023 the S&P 500 was up 10.3% per year so it’s not like the best-performing survivors crushed the market by leaps and bounds.
But those above-average returns compounded over 98 years added up to incredible growth over that time.
That compounding has been magic for the stock market.
Further Reading:
Power Laws in the Stock Market
