A colleague recently asked me to run the 30 year annual returns for U.S. stocks, bonds and cash.
He just wanted the returns. I couldn’t help but slice and dice the numbers and overanalyze the data because that’s what we do here.
Let’s dig in.
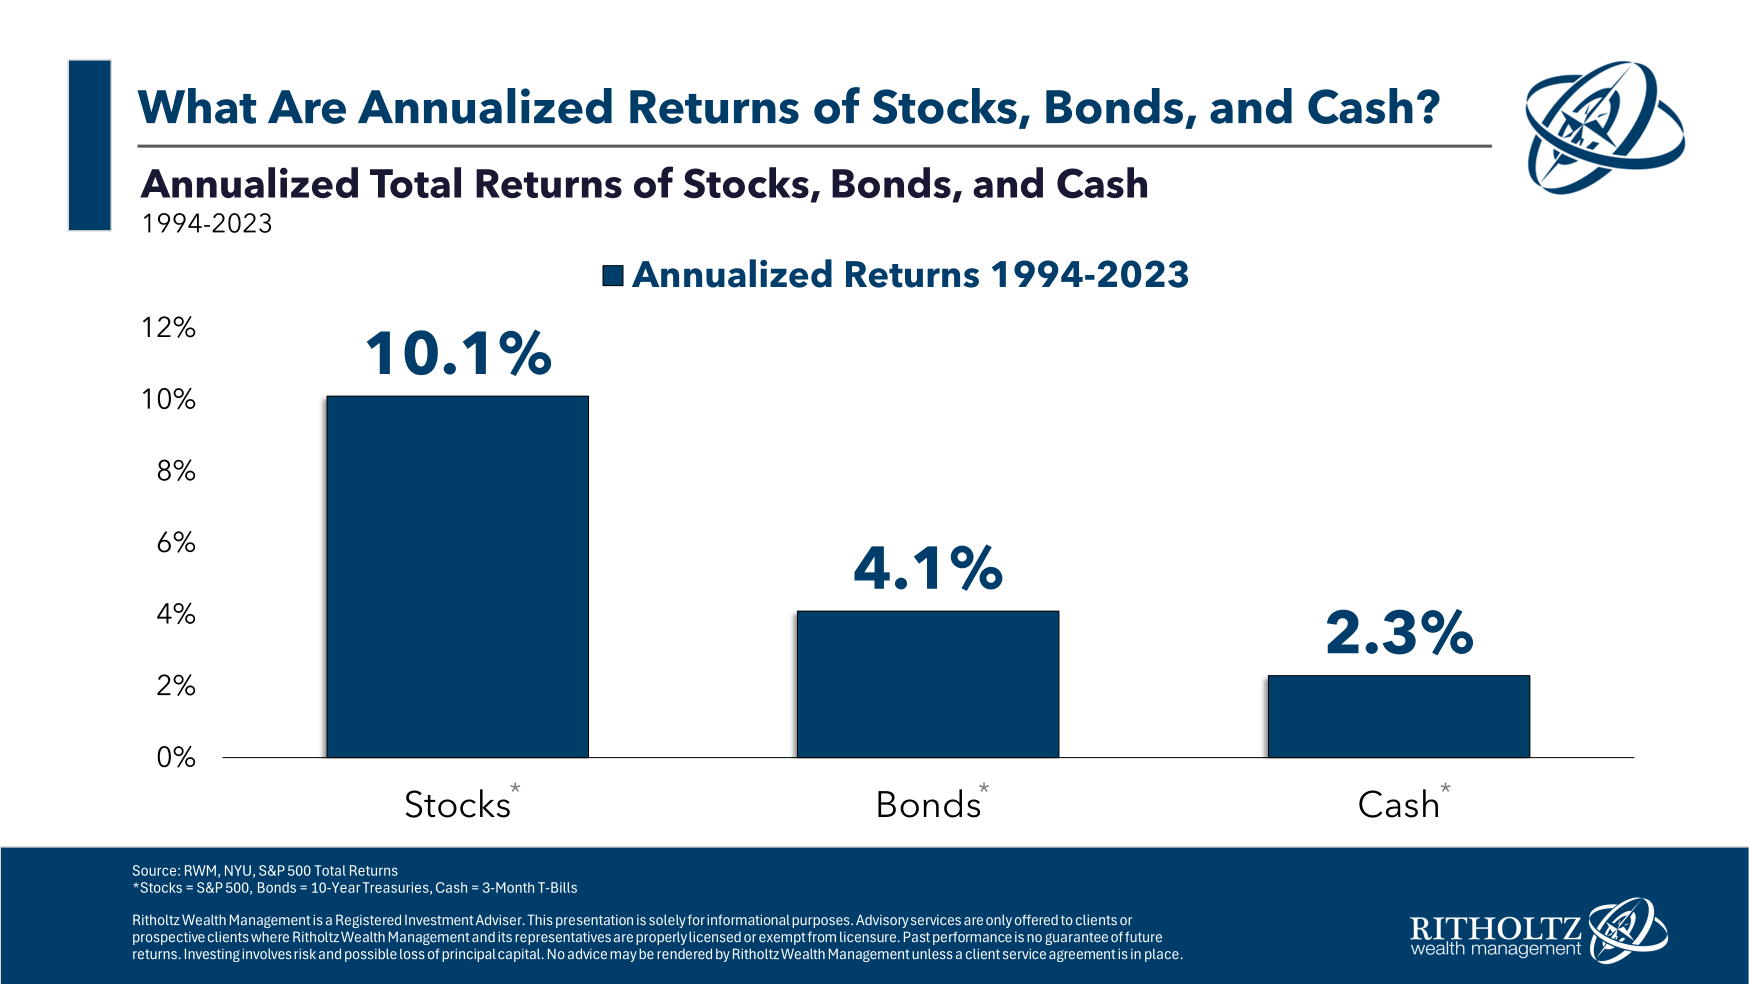
First the annual return numbers for the S&P 500, 10 year treasuries and 3 month T-bills over the 30 years ending in 2023:
Some thoughts about these numbers:
Stock returns look average despite the turmoil. From 1994 to 2023, there was the dot-com bubble, a 50% crash, 9/11, a housing bubble, the Great Financial Crisis (which came with another 50%+ crash), a handful of wars, 3 recessions and a pandemic.
And yet…the stock market was up 10% per year.
We had booms and busts, ups and downs, good and bad, but things still turned out OK.
No guarantees about the future but that’s still pretty impressive.
Bond returns weren’t bad despite the bear market. Yields on government bonds have been below average for some time now. We’re still in the midst of the worst bond bear market of all-time.
In 2022 and 2023, 10 year Treasuries were down 22% in total.1
The 5 worst calendar year returns for U.S. government bonds since 1928 have all come in the past 30 years. Three of those five years have occurred since 2009.
Starting yields were higher in the mid-1990s2 and falling rates helped, especially in the first decade of this century.
But 4% returns are not bad considering how weird the yield situation has been for the past 15 years or so.
Cash returns were respectable despite 0% yields for so long. T-bill returns of a little more than 2% per year aren’t great when considering inflation in the 30 years ending 2023 was 2.5% per year.
More than half (16) of the past 30 years have been returns under 2%. Eleven times the returns have been under 1% in a calendar year.
But now T-bill yields are over 5%!
I don’t know how long that’s going to last but it means returns are much higher (for now) than they’ve been in many years.
In fact, the prospects for cash and bonds are both in a much better place than they’ve been in some time.
Here are some more quick-hit stats:
- Stocks were up 80% of the time over the past 30 years. The stock market was down double digits 4 times but up double digits in 19 out of 30 years. Four out of every 10 years the S&P 500 was up 20% or more. The best annual return was +37%. The worst annual return was -37%.
- Bonds were up 80% of the time over the past 30 years. The bond market was down double digits twice (2022 and 2009) and up double digits in 9 years. The best annual return was +24%. The worst annual return was -18%.
- Cash didn’t have a single negative (nominal) year but it also had the worst annual returns over the past 30 years. The best annual return was +6% while the worst return was 0%.
I don’t know what the next three decades will bring but there will likely be recessions, bear markets, geopolitical crises, war, maybe pestilence, and who knows what else.
But I do know that not investing your money guarantees you will fall behind inflation.
And I have a feeling risk will be rewarded with higher returns.
I just don’t know exactly what those returns will be.
They wouldn’t be called risk assets if there was no risk.
Further Reading:
Historical Returns For Stocks, Bonds & Cash
1Meaning yields included.
2Around 6% heading into 1994.
