On this week’s podcast we discussed what would have to happen for stocks to continue doing well over the next 5 years or so:
Short of an asteroid discovery that will change humanity and the stock market forever1 it would seem the most logical path from here would be lower than average returns. Typically, that’s what happens after periods of higher than average returns.
But it’s not always so easy to make return forecasts even going 5 years out into the future.
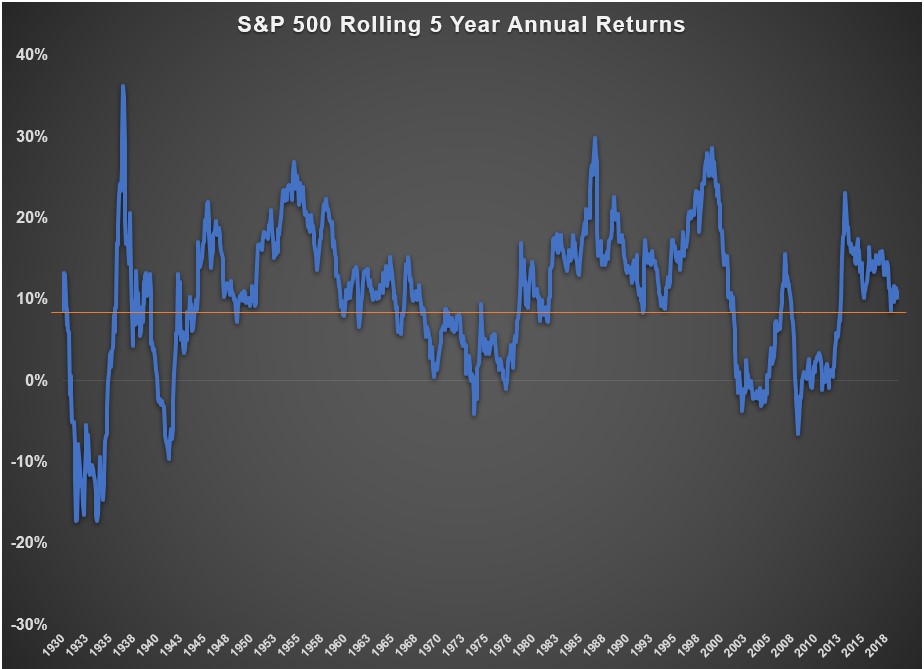
Here’s how often the S&P 500 has been up 8% annually over 5 years going back to 1926:

In roughly 66% of all rolling 5 year windows, stocks were up at least 8% or more on an annual basis. That means 34% of the time stocks failed to rise 8% or more annually. That’s risk for you.
BUT many will point to the fact that valuations are much higher now, making it easier to forecast lower than average returns from here. And I would agree that investors should rein in their expectations from here.2
However, even with the knowledge of higher valuations, it’s still tricky to predict what will happen because it’s impossible to forecast investor behavior.
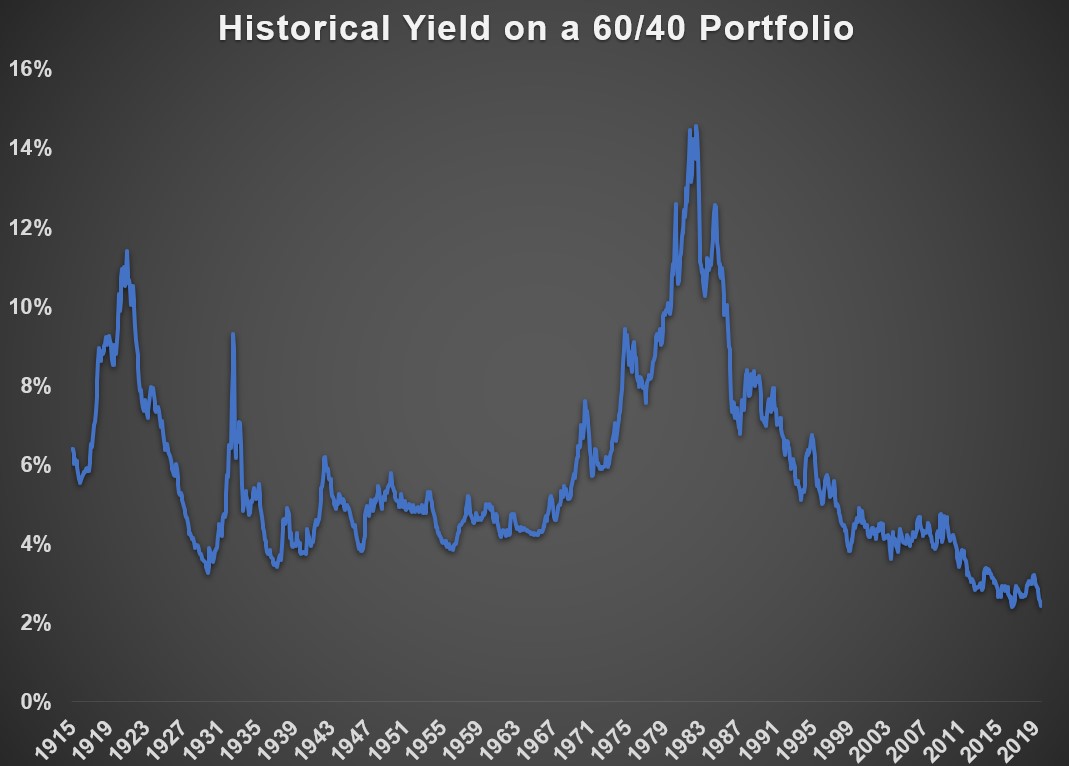
For example, last week I shared the following chart showing the historical yield on a 60/40 portfolio3 going back to 1915:

The 60/40 yield is about as low as it’s been over the past 100+ years, not a great sign for forward returns in U.S. financial assets.
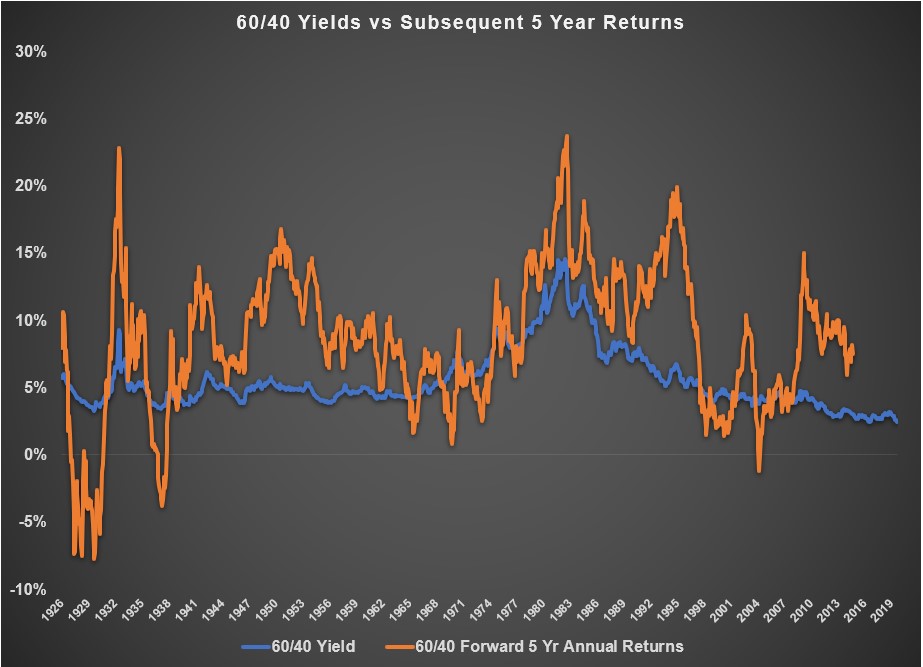
What I didn’t do was follow this up with how the 60/40 actually performed from these starting yields. I don’t have total return data back to 1915, but here are the subsequent 5 year annual returns for a 60/40 portfolio going back to 1926 overlaid on top of the starting yield in the portfolio:

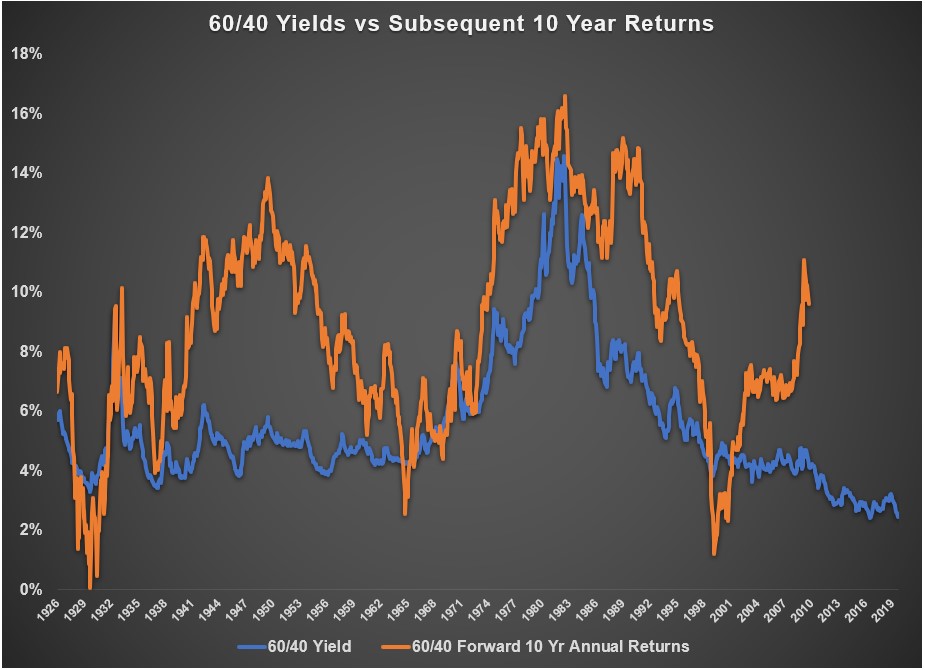
You can see some massive divergences here between starting yields and subsequent returns. 5 years may not be enough time for fundamentals to take over so let’s take a look at 10 year forward returns from these same starting yield levels:

There is a positive relationship between starting yield and forward returns (0.57 over 5 years and 0.73 over 10 years) but you can see even the 10 year numbers are all over the map.
I’m sure you could poke holes in my simple valuation metrics used here. You could find lines that match up much better if you tortured the data a little more. But the point here is that fundamental analysis can only take you so far.
If fundamentals dictated exactly what’s going to happen going forward everyone with an Internet connection could pull up the current CAPE, P/E, P/S, P/FCF or whatever other metrics you want to use to predict the future.
But fundamentals don’t dictate exactly what’s going to happen. Mood and sentiment play a role in asset returns. How investors choose to allocate their assets can change return dynamics. And what people’s views are about the future can have an impact, even going out 5 to 10 years into the future.
A reasonable person would logically conclude U.S. financial assets should see lower returns from current levels.
But good luck predicting when those lower returns start, how long they last, and when investors begin to pay attention to fundamentals yet again.
*******
More highlights from this week’s show on the streaming wars:
Subscribe to the Animal Spirits playlist to watch these highlights every week.
Now here’s what I’ve been reading lately:
- How financial bubbles work (The Onion)
- Andre the Giant vs. the Cedar Rapids police (The Gazette)
- Evolve or die (Micro Cap Club)
- Where’s the buyback beef? (Irrelevant Investor)
- Podcast: Meb Faber talks with GMO’s Ben Inker (Meb Faber)
- When a financial advisor knocks on the door (Morningstar)
- De Niro and Pacino (NY Times)
- More money, more problems? (Belle Curve)
- Adam Neumann is the most talented grifter of our generation (Atlantic)
1Are you thinking what I’m thinking — Armageddon 2: Saving the Stock Market with Ben Affleck, Owen Wilson, Steve Buscemi, Billy Bob and Liv Tyler? Who says no?
2An argument that could have been made for the past 7 years or so but still.
3Using the earnings yield on the S&P 500 CAPE ratio and the 10 year treasury yield.
