A reader asks:
I’ve heard ad nauseam that we are in the late innings of the expansion, but also that since we are at near 3% GDP, it is unlikely for us to quickly go into negative GDP growth and a recession. Would a certain level of GDP make it unlikely that a recession is close, or is that a false narrative?
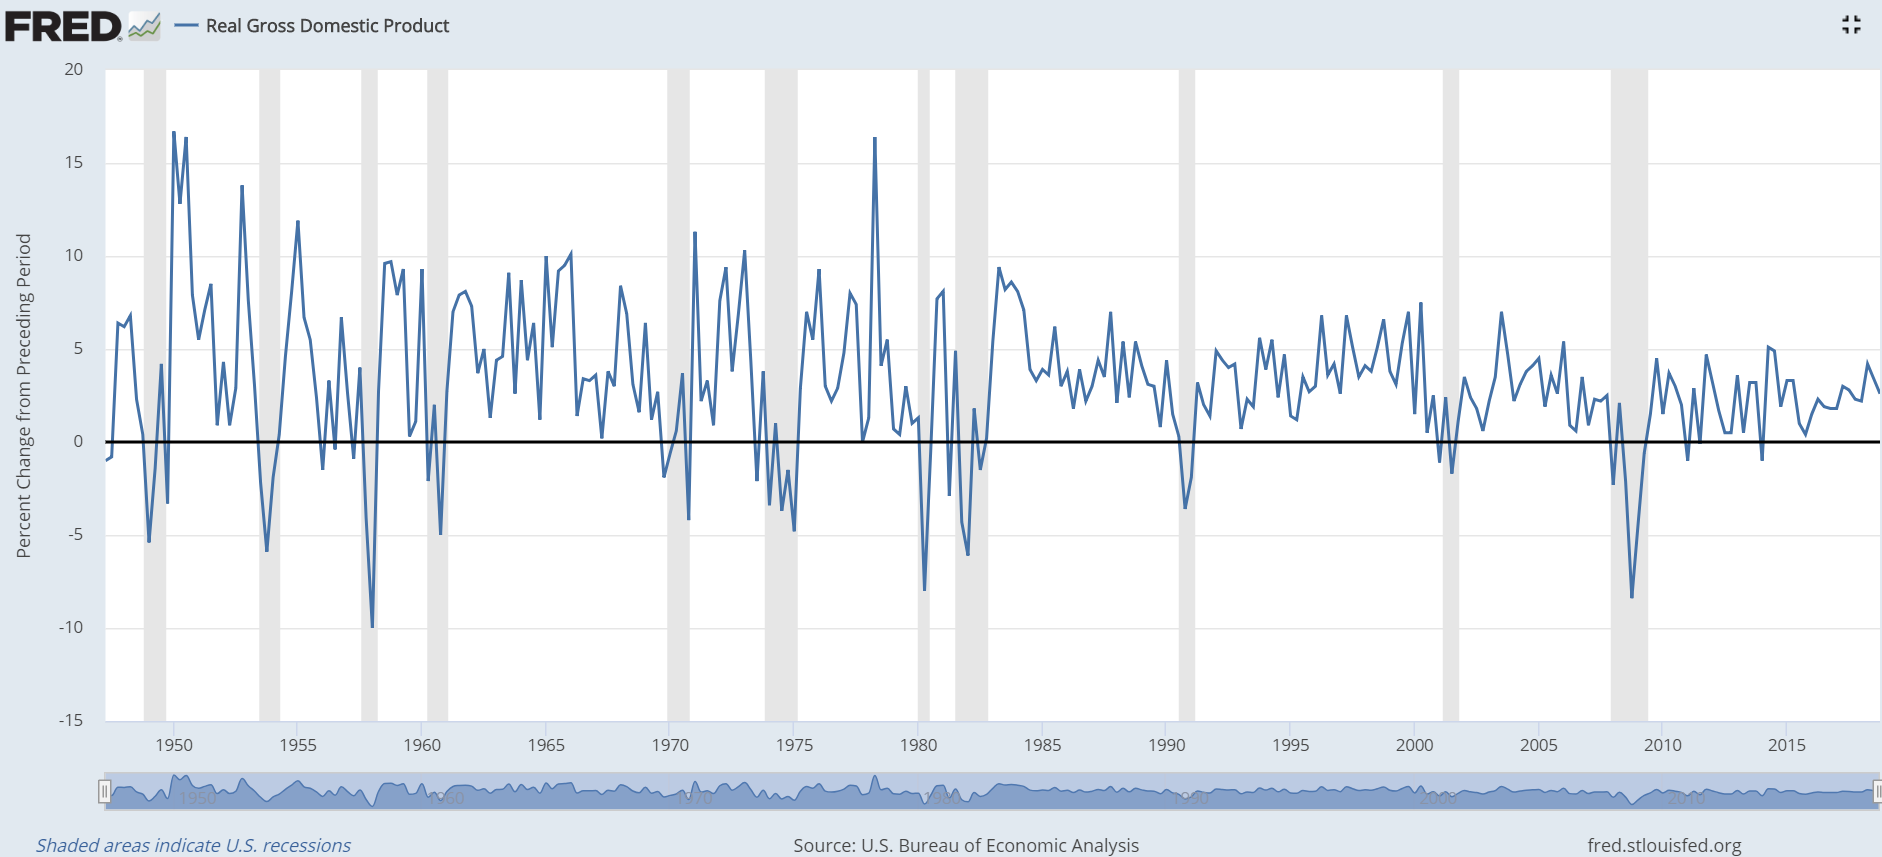
When you look at the real GDP figures over time the data is noisy to say the least:

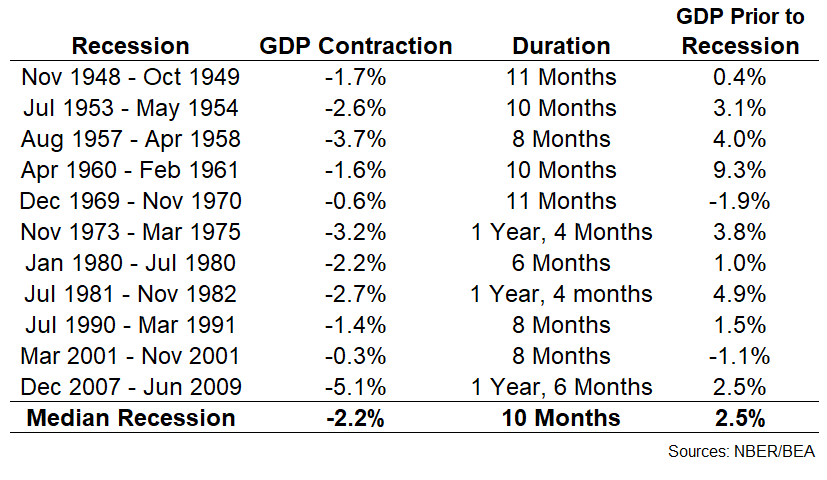
The shaded parts of the graphs indicate a recession and you can see the results are all over the place leading up to a recession. Here’s the data for each recession since the late-1940s:

The last column shows the last real GDP reading prior to the onset of a recession. The early-1960s is the obvious outlier which saw enormous economic growth just before a minor recession but you can see there isn’t much rhyme or reason in the predictive power of real GDP. There’s no tell that will help you figure out what happens next.
It’s also important to provide some caveats whenever looking at the economic growth numbers as well:
GDP can be revised substantially. The BEA provides quarterly estimates but they also revise GDP numbers annually and put in place benchmark revisions every few years as well. So looking at the historical data may not be all that useful because the way economists measure the data changes over time.
Five Thirty Eight estimates there could be as much as a 1.5% difference after all is said and done with the revisions over time. For an economy that grows in the 2-3% range, that’s a huge difference.
The recession will probably start before you even know it. Many assume a recession is simply two consecutive down quarters in real GDP. The National Bureau of Economic Research (NBER) actually defines a recession as “a significant decline in economic activity spread across the economy, lasting more than a few months, normally visible in real GDP, real income, employment, industrial production, and wholesale-retail sales.”
And it can take time for NBER to reach that conclusion. The last recession began in December 2007 but they didn’t call it for another 11 months. The low point was June 2009, which was a point the committee determined 15 months later.
In fact, it’s taken NBER anywhere from 6 to 21 months in the past to determine economic peaks and troughs.
The U.S. economy is huge and therefore complex. Our economy is roughly $20 trillion. If you stacked $20 trillion in one dollar bills, that stack would reach…really high (rough estimate). An economy of this size is highly complex, dynamic, and ridiculously difficult to gauge in real-time.
I’m not saying there won’t be any people or organizations who call the next downturn. The sheer size of the prediction machine these days almost guarantees someone will nail it perfectly. I’m also not saying there aren’t people and organizations out there putting out useful work on economic data. There certainly are.
What I am saying is take any historical formulas, backtests, or charts with a huge grain of salt, especially when it comes to economic data.
Further Reading:
Is the U.S. Due For a Recession?
