A reader asked this week if I would update an old performance chart of the S&P 500 I used a few years ago.
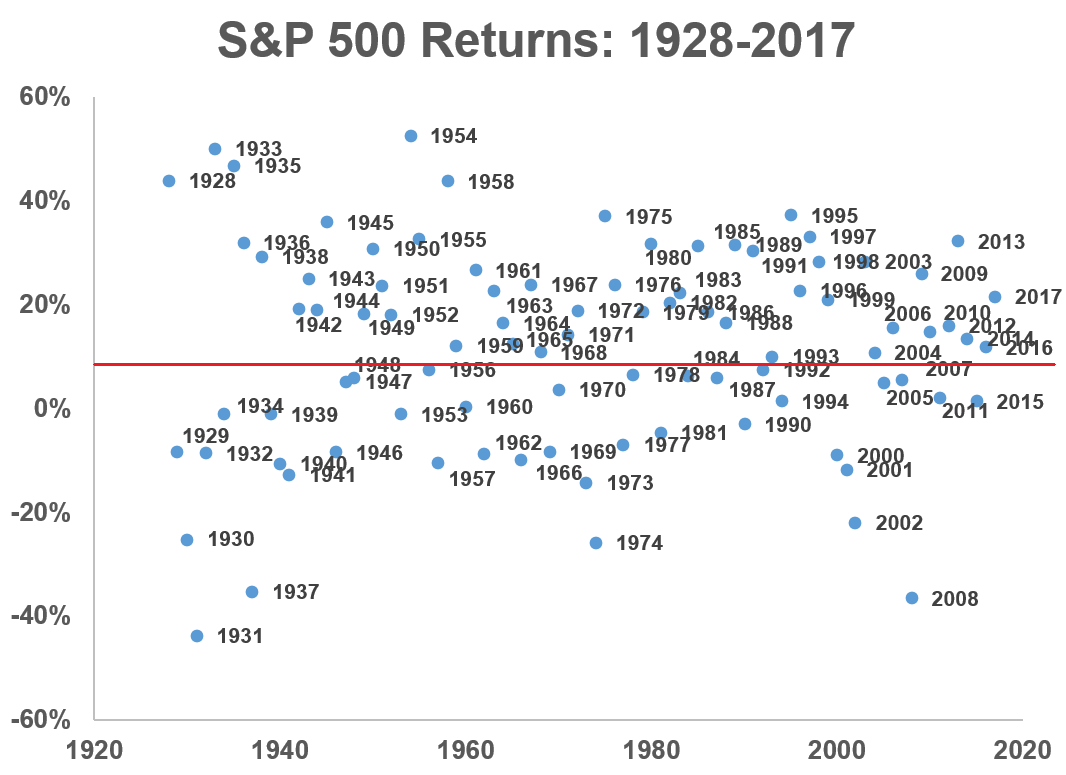
Here are the S&P 500 calendar year returns shown as a scatter plot:

The red line is the average so you can see how wide the fluctuations are from year to year. It’s also interesting to note how few annual returns are anywhere near the long-term average. These inconsistencies are one of the reasons the stock market befuddles so many people.
While updating this graph I decided to see how this format would look using different asset classes so I could compare stocks, bonds and cash.
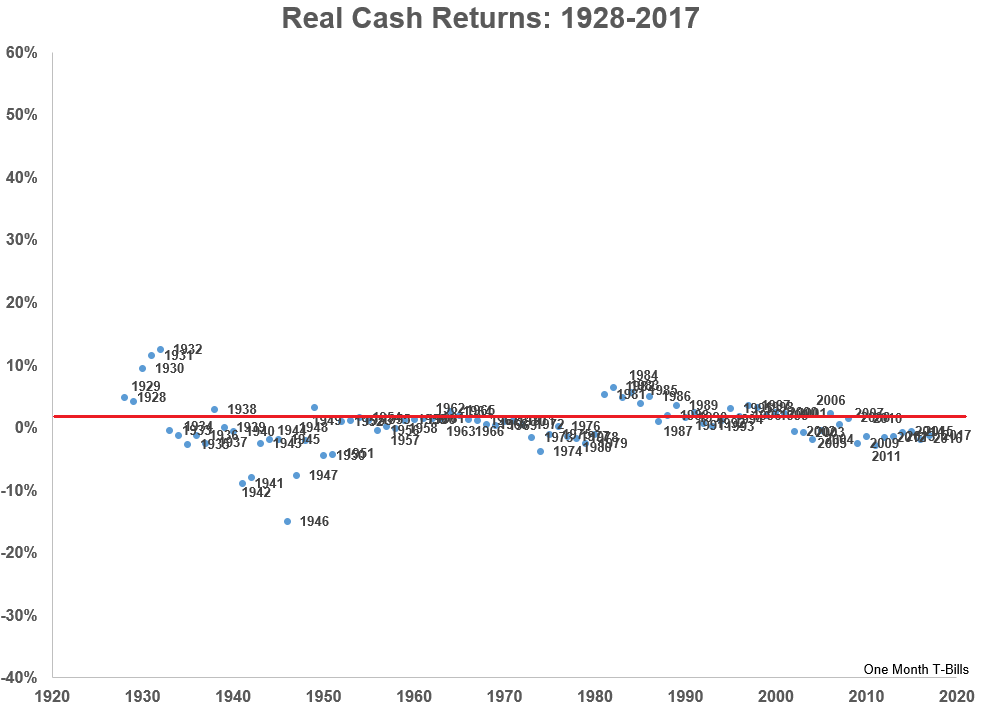
I used real returns to account for the fact that nominal interest rates can make the bond and cash returns look higher than they appeared in the past. Here are the cash returns using one-month t-bills as a proxy:

It may be surprising to some to see so many slightly negative years but that’s what happens when there’s above average inflation, even when rates were in double-digit territory in the late-1970s and early-1980s.
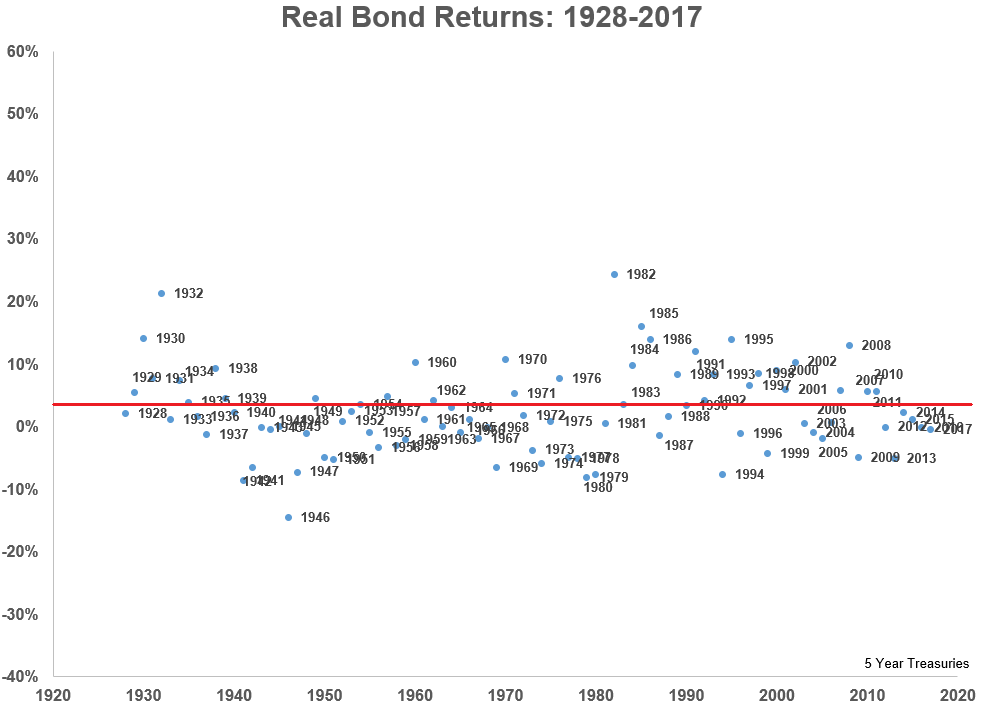
And here are after-inflation bond returns using 5-year treasuries:

Even bonds give you a somewhat bumpy ride around the long-term averages.
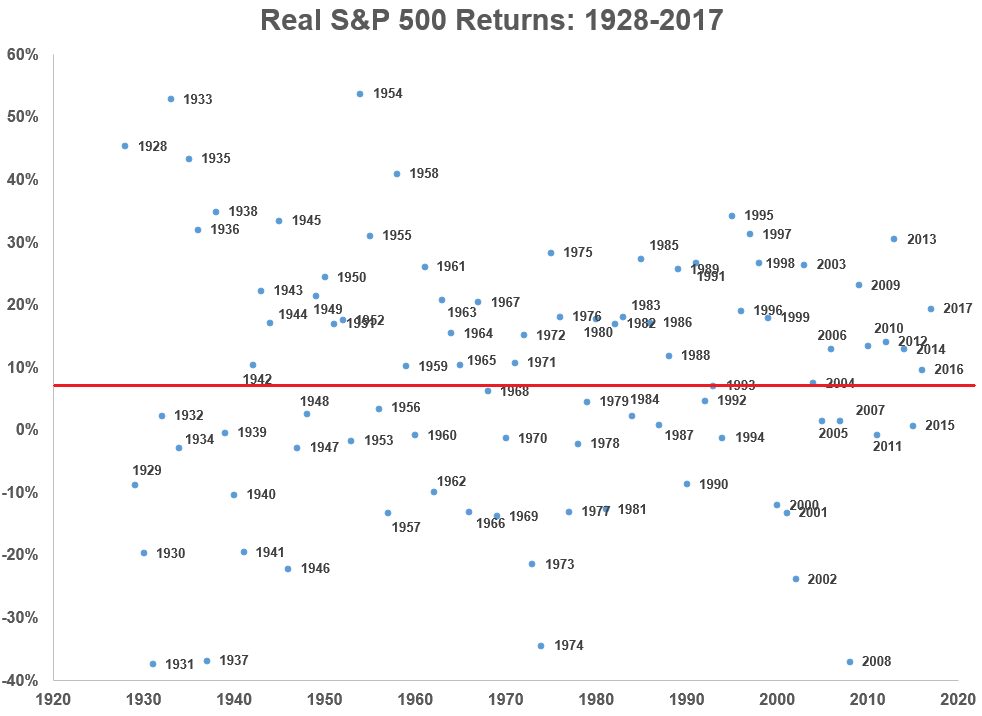
Now for stocks on a real basis:

These graphs provide a nice visual of the risk-reward relationship that exists in these various asset classes. Now here are all three next to each other to gain a cleaner look at them side-by-side:

At first glance, most investors probably wonder why they would ever accept the insanity of the stock chart when they could take the relative calm of the bond or cash return stream. These fluctuations are explained by the fact that stocks have returned a little more than 7% above the rate of inflation while bonds and cash have real returns of 2.2% and 0.5%, respectively.
If you want more predictability in the short-term, you have to learn to live with lower long-term returns. And if you want higher long-term expected returns, you have to learn to live with more volatility in the short-term.
This stuff is pretty basic but investors often need a reminder to understand the possibilities based on their asset allocation.
*******
Now here’s what I’ve been reading lately:
- The first law of finance is that there are no laws (Abnormal Returns)
- Lessons from Jim O’Shaughnessy (25iq)
- The humility curve (Tim Hanson)
- The history of Google Maps (Irrelevant Investor)
- The asset of gratitude (I Heart Wall Street)
- Profiting from investment regret (Morningstar)
- How do you start a life these days? (Reformed Broker)
- Video: Can you mix bitcoin with financial advice? (The Compound)
- The best year for Tom Cruise movies (The Ringer)
