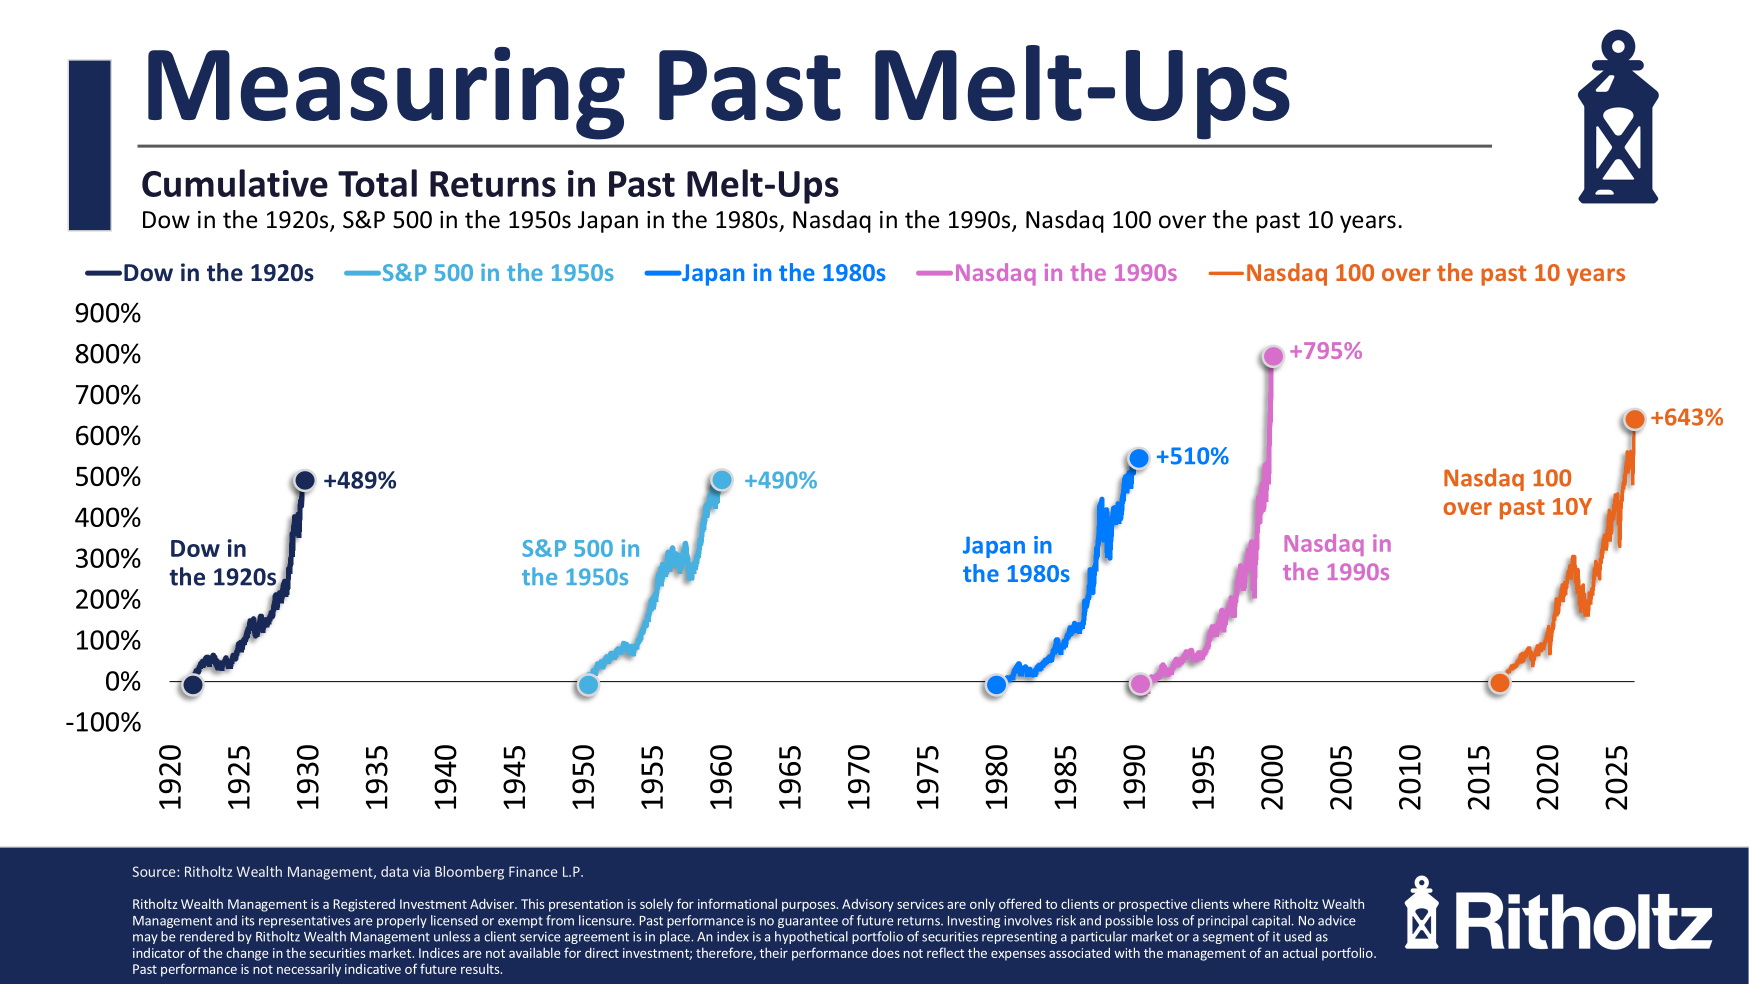
This past week I wrote about a possible melt up in the Nasdaq 100.
This chart is a good summary of that post:
The logical follow-up question (which many people asked) is this: Is this a bubble?
The Roaring 20s were a bubble. The 1950s weren’t a bubble. Japan was a bubble. The dot-com boom was a bubble.
This can be a difficult question to answer because everyone knows when we’re in a financial crisis but people aren’t very good at bubble calling.
A lot of people assume this is the next dot-com bubble. They might be right. We shall see. But it’s worth running through a comparison of the two time periods to get a better sense of the underlying fundamentals.
Mark Marex at Nasdaq wrote a research piece titled “Is AI Another Bubble For the Nasdaq 100?” that seeks to answer this question.
There were far more unprofitable companies back then:
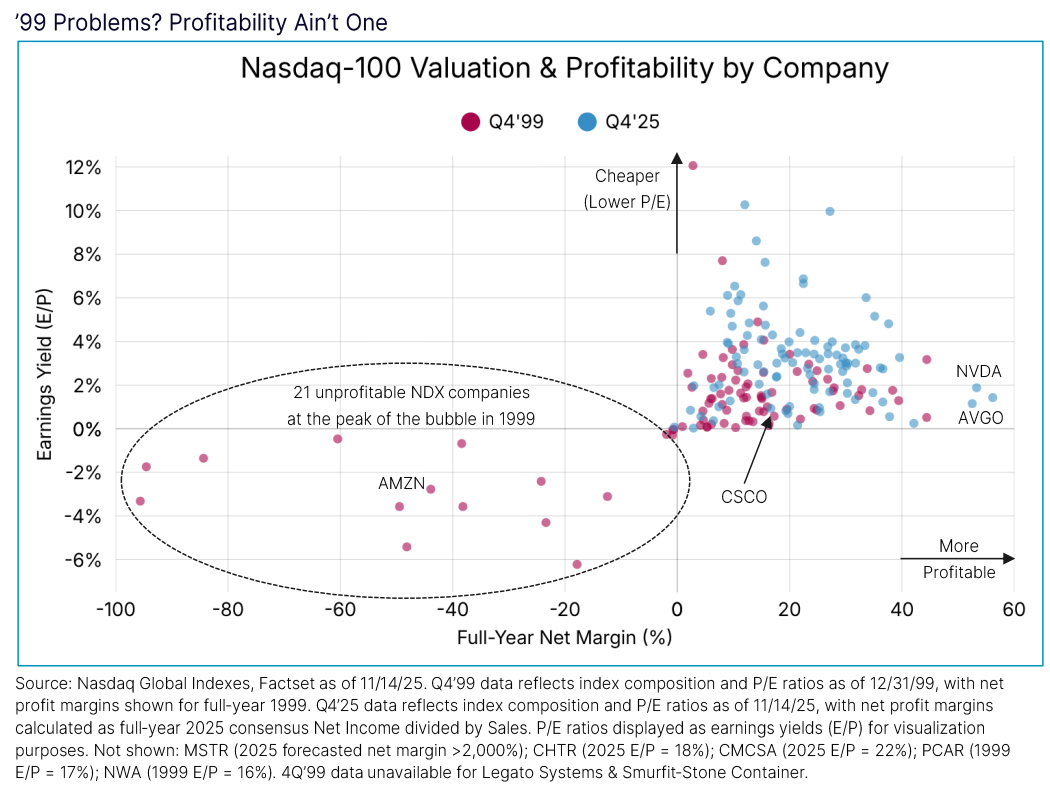
Today the companies are more profitable and have higher earnings yields.
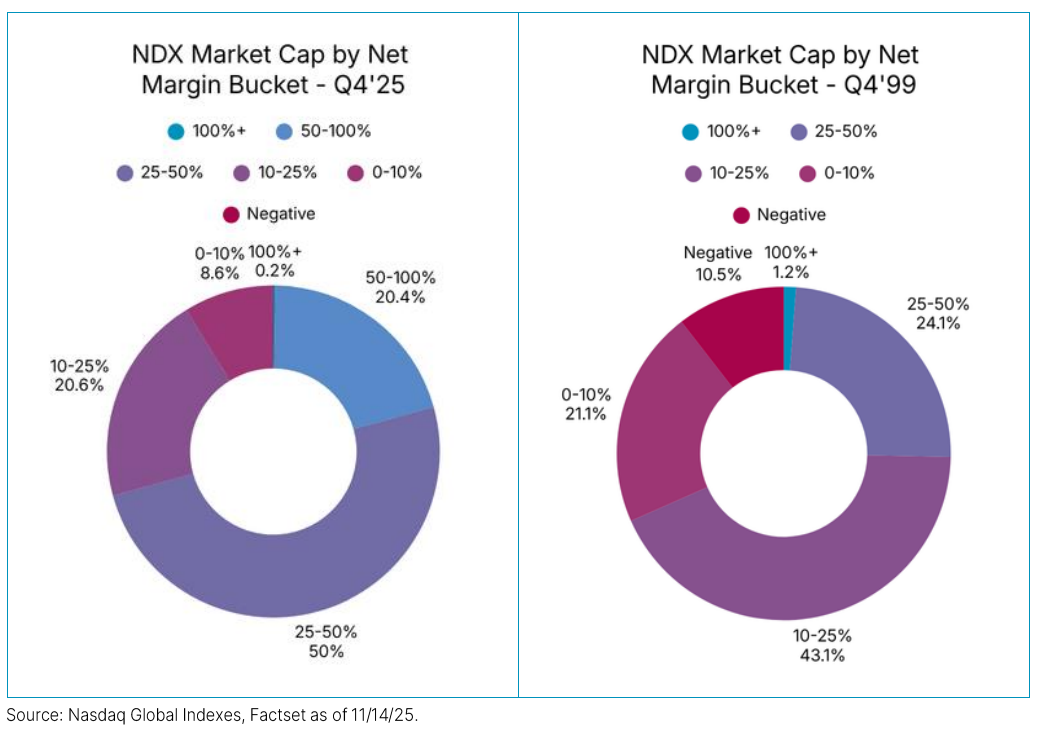
They have higher margins today too:
Valuations are much more reasonable today when you consider the different P/E ratio buckets companies fall into versus the late-1990s:
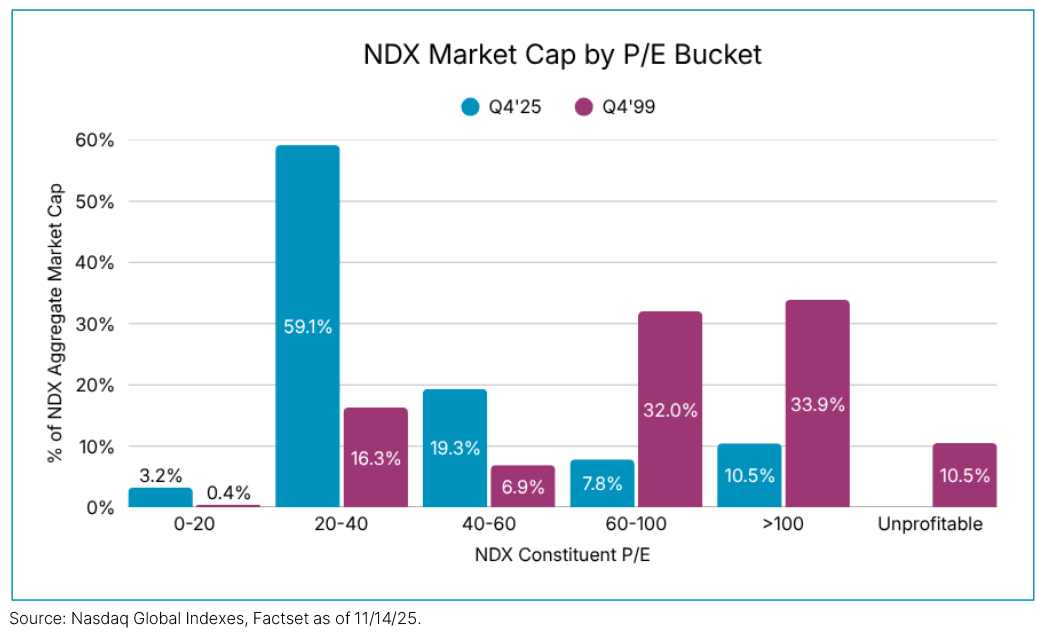
In 1999, more than 76% of stocks in the Nasdaq 100 had P/E ratios of 60x or higher. Today it’s just 18% of the total.
It wasn’t just a handful of tech stocks in the dot-com bubble that were overvalued. It was damn near the entire market of tech stocks.
Right or wrong, good or bad, the Qs are far more concentrated today than back in 1999:
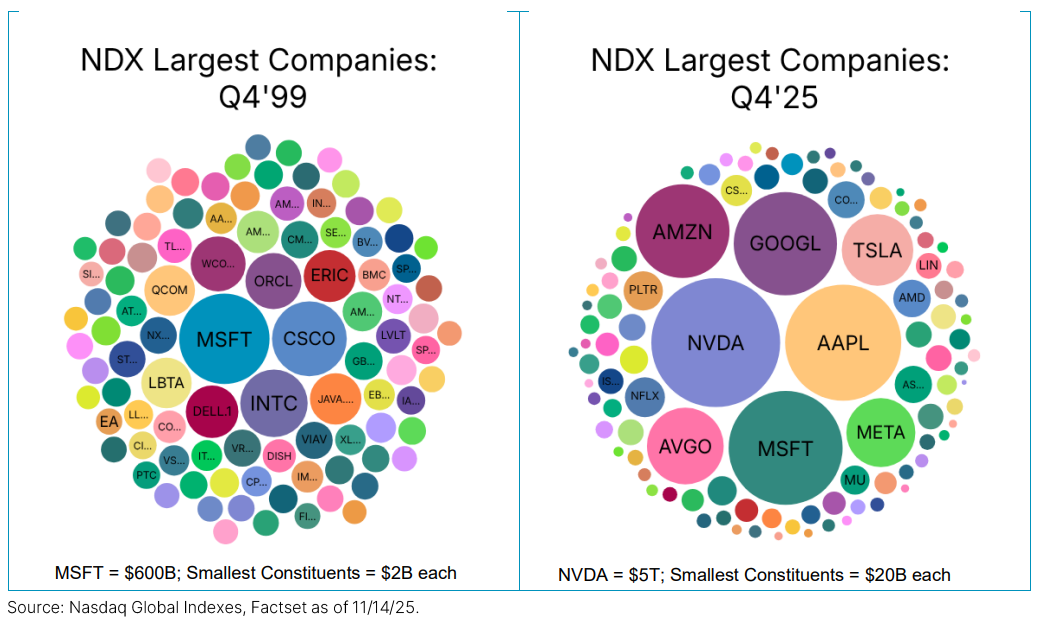
Most of the mega cap tech companies have simply bought out the competition so there is more underlying diversification than you think.
Of course, making comparisons to perhaps the biggest bubble in U.S. stock market history might not be fair.
Just because it’s not bigger than the biggest bubble does not prove that today is or is not a bubble. Maybe it’s just a bubble on a smaller scale.
That’s certainly possible.
However, if this is a bubble it’s the most logical mania in history.
Just look at the annualized earnings growth for the Nasdaq 100 going back 5, 10, 15 and 20 years:
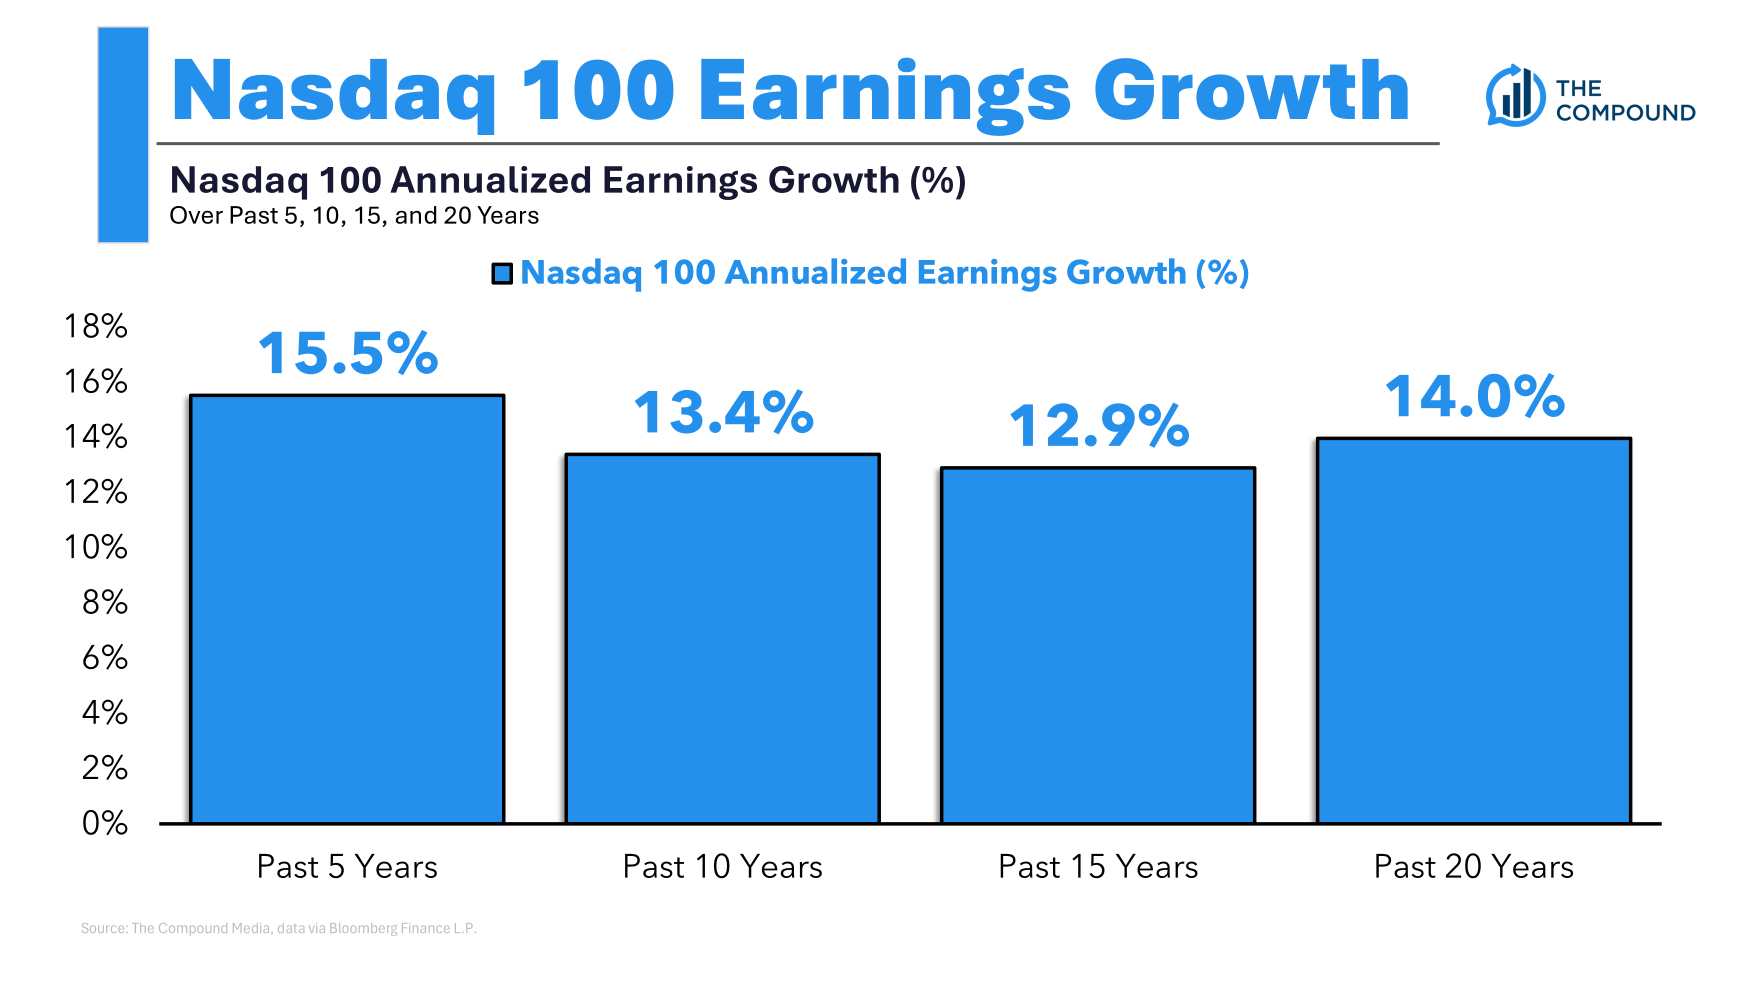
Double-digit earnings growth for such an extended period of time shows the fundamentals are coming along for the ride. Prices are not necessarily detached from reality.
Here are the annual Nasdaq 100 returns over the same time frames:
- Past 5 years +17.5%
- Past 10 years +21.9%
- Past 15 years +19.1%
- Past 20 years +16.3%
It’s not a perfect one-to-one relationship. But 14% annual earnings growth over the past 20 years along with 16% annual returns is pretty tough to beat.
Most asset bubbles involve the suspension of disbelief when it comes to prices and fundamentals.
I’m not saying the market can’t fall. It can.
I’m not saying the market can’t crash. It can.
But I am saying this is one of the more difficult booms to handicap because of the fact that earnings are rising in concert with prices.
I was on The Compound and Friends with Josh, Michael and Kai Wu this week talking about tech stocks, valuations, AI and more:
Further Reading:
The Melt-Up

