I love stock market charts that drive home the benefits of long-term investing.
The longer your time horizon, the better your odds have been of experiencing gains in the stock market:
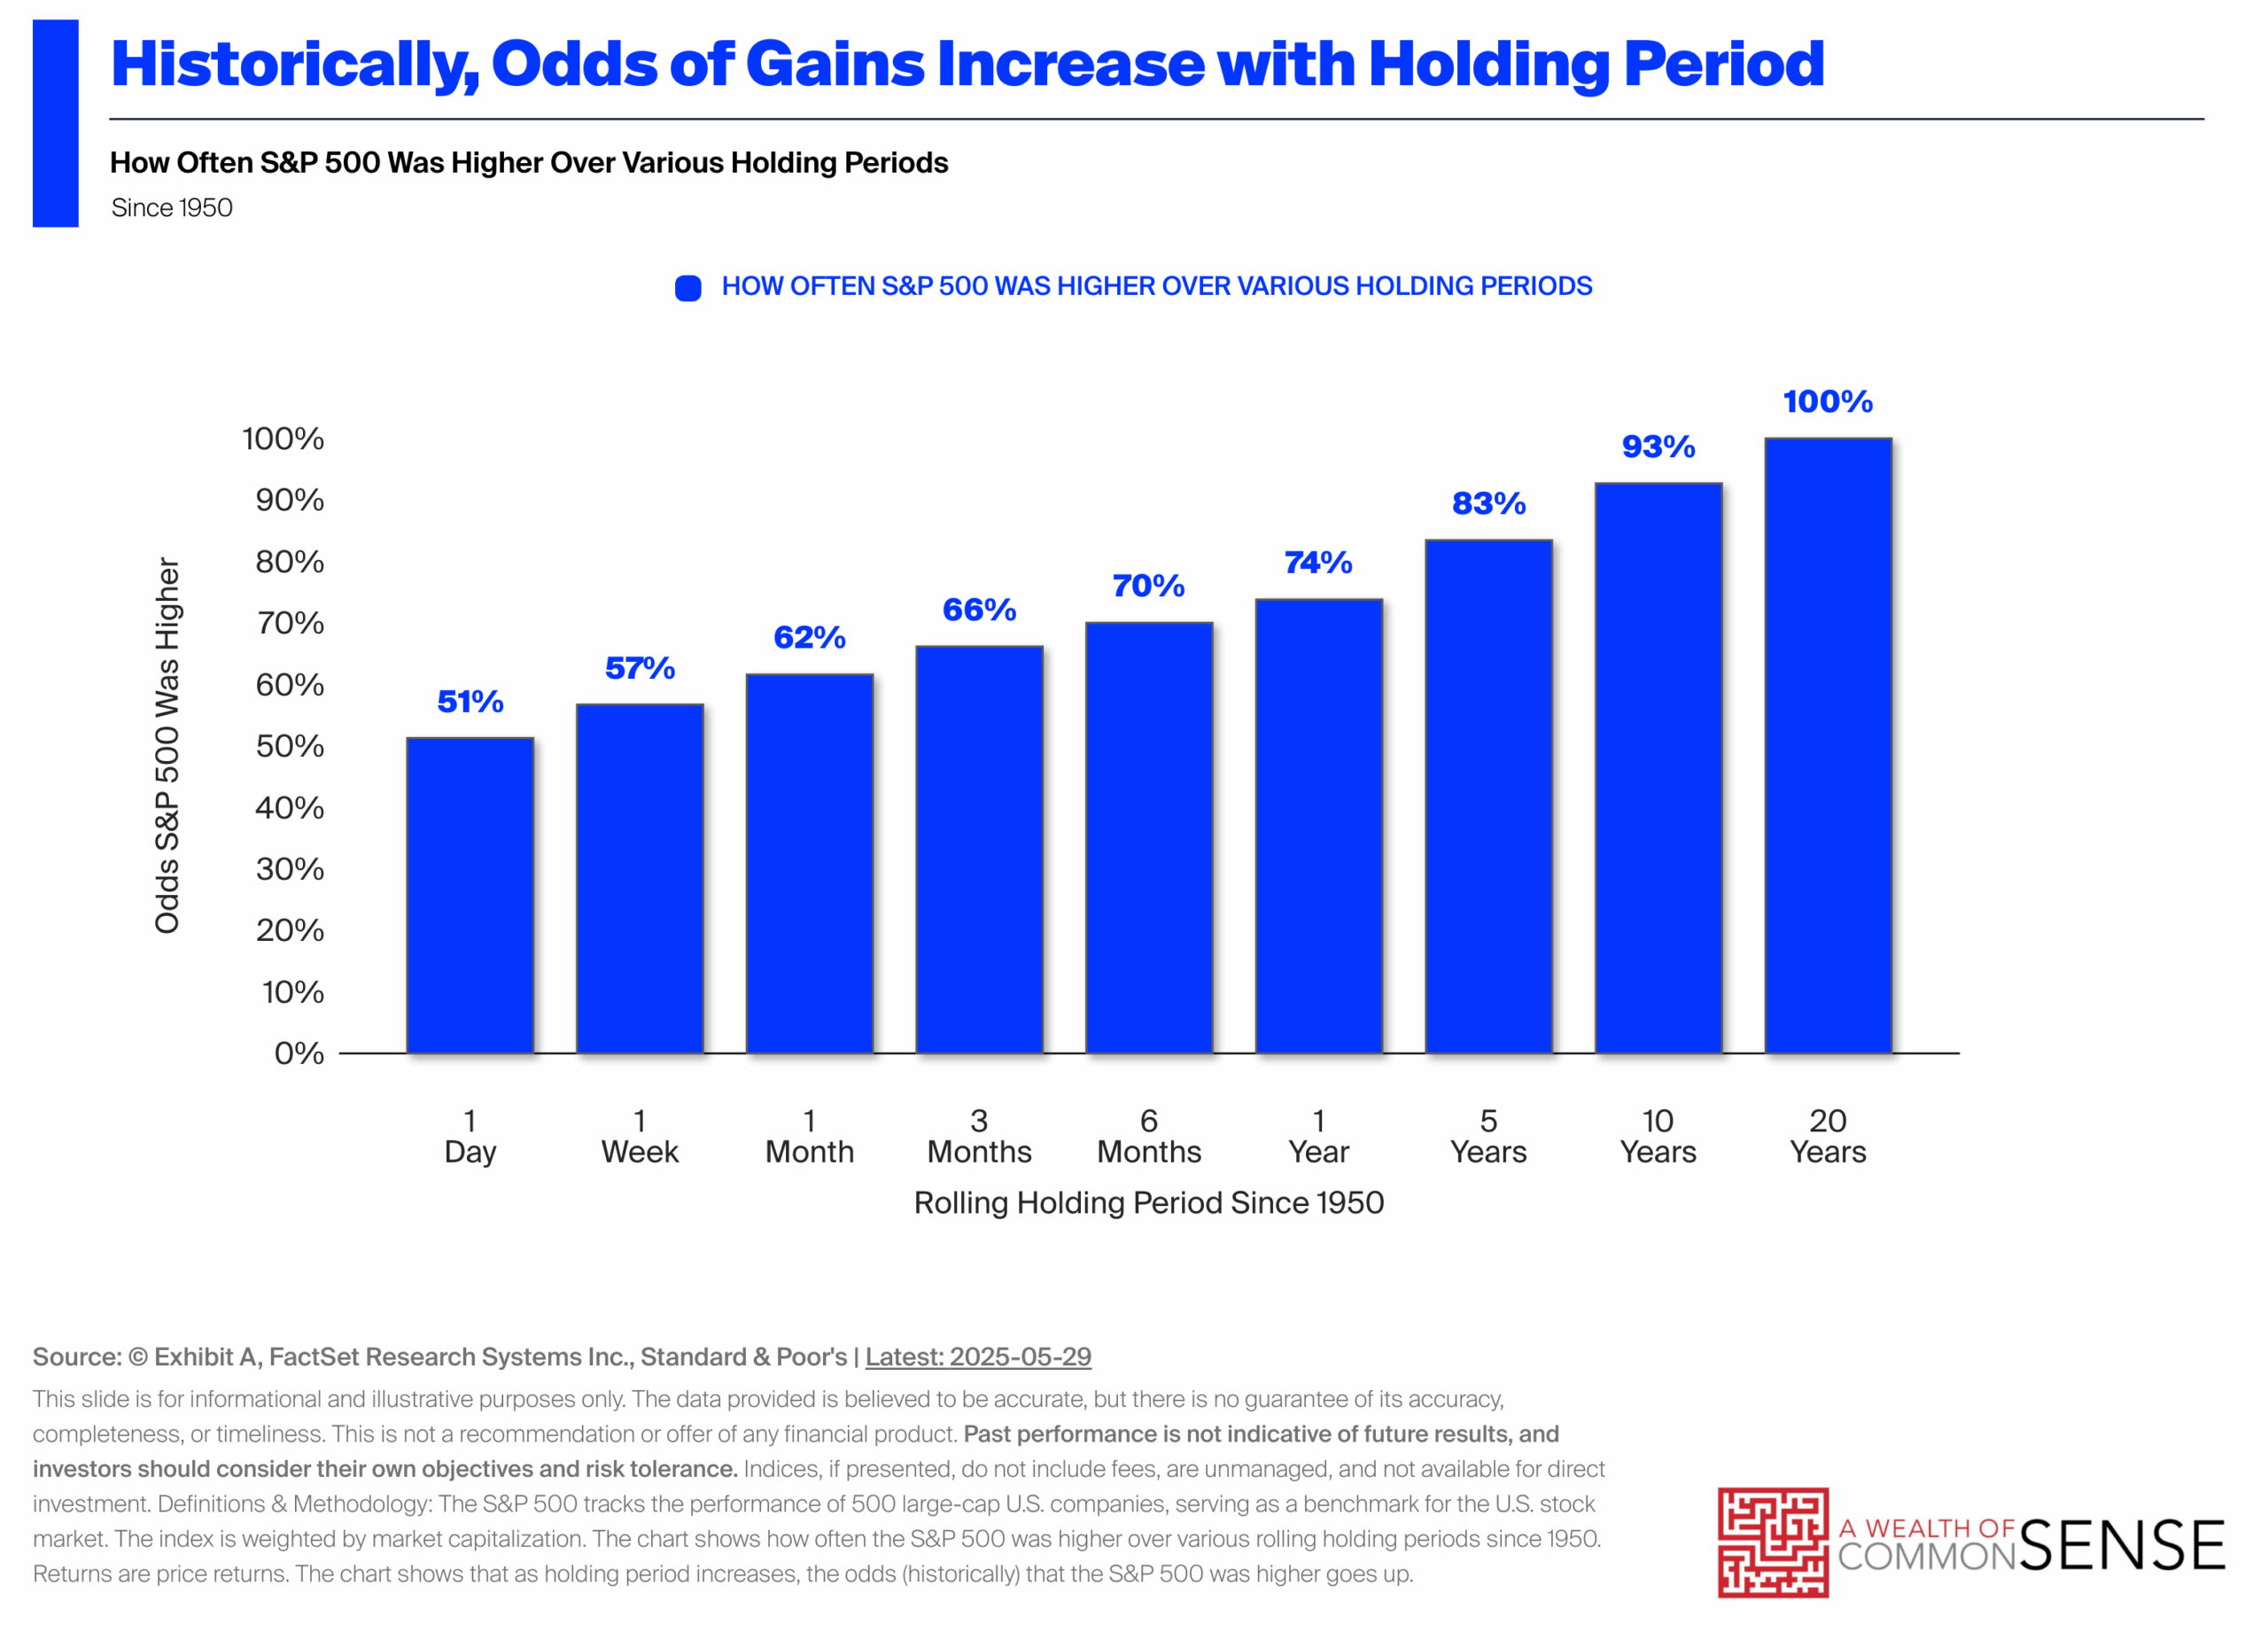
This is one of my all-time favorite charts. I use it all the time and I’ll keep using it because it provides a valuable reminder that the long run is your friend as an investor.
Everyone needs those reminders because the short-term is up in your face all the time. Thinking and acting for the long-term works.
But it’s important to understand that the longer your time horizon the higher the probability you’ll experience big losses too.
These are your historical odds of experiencing a bear market over various holding periods going back to 1950:
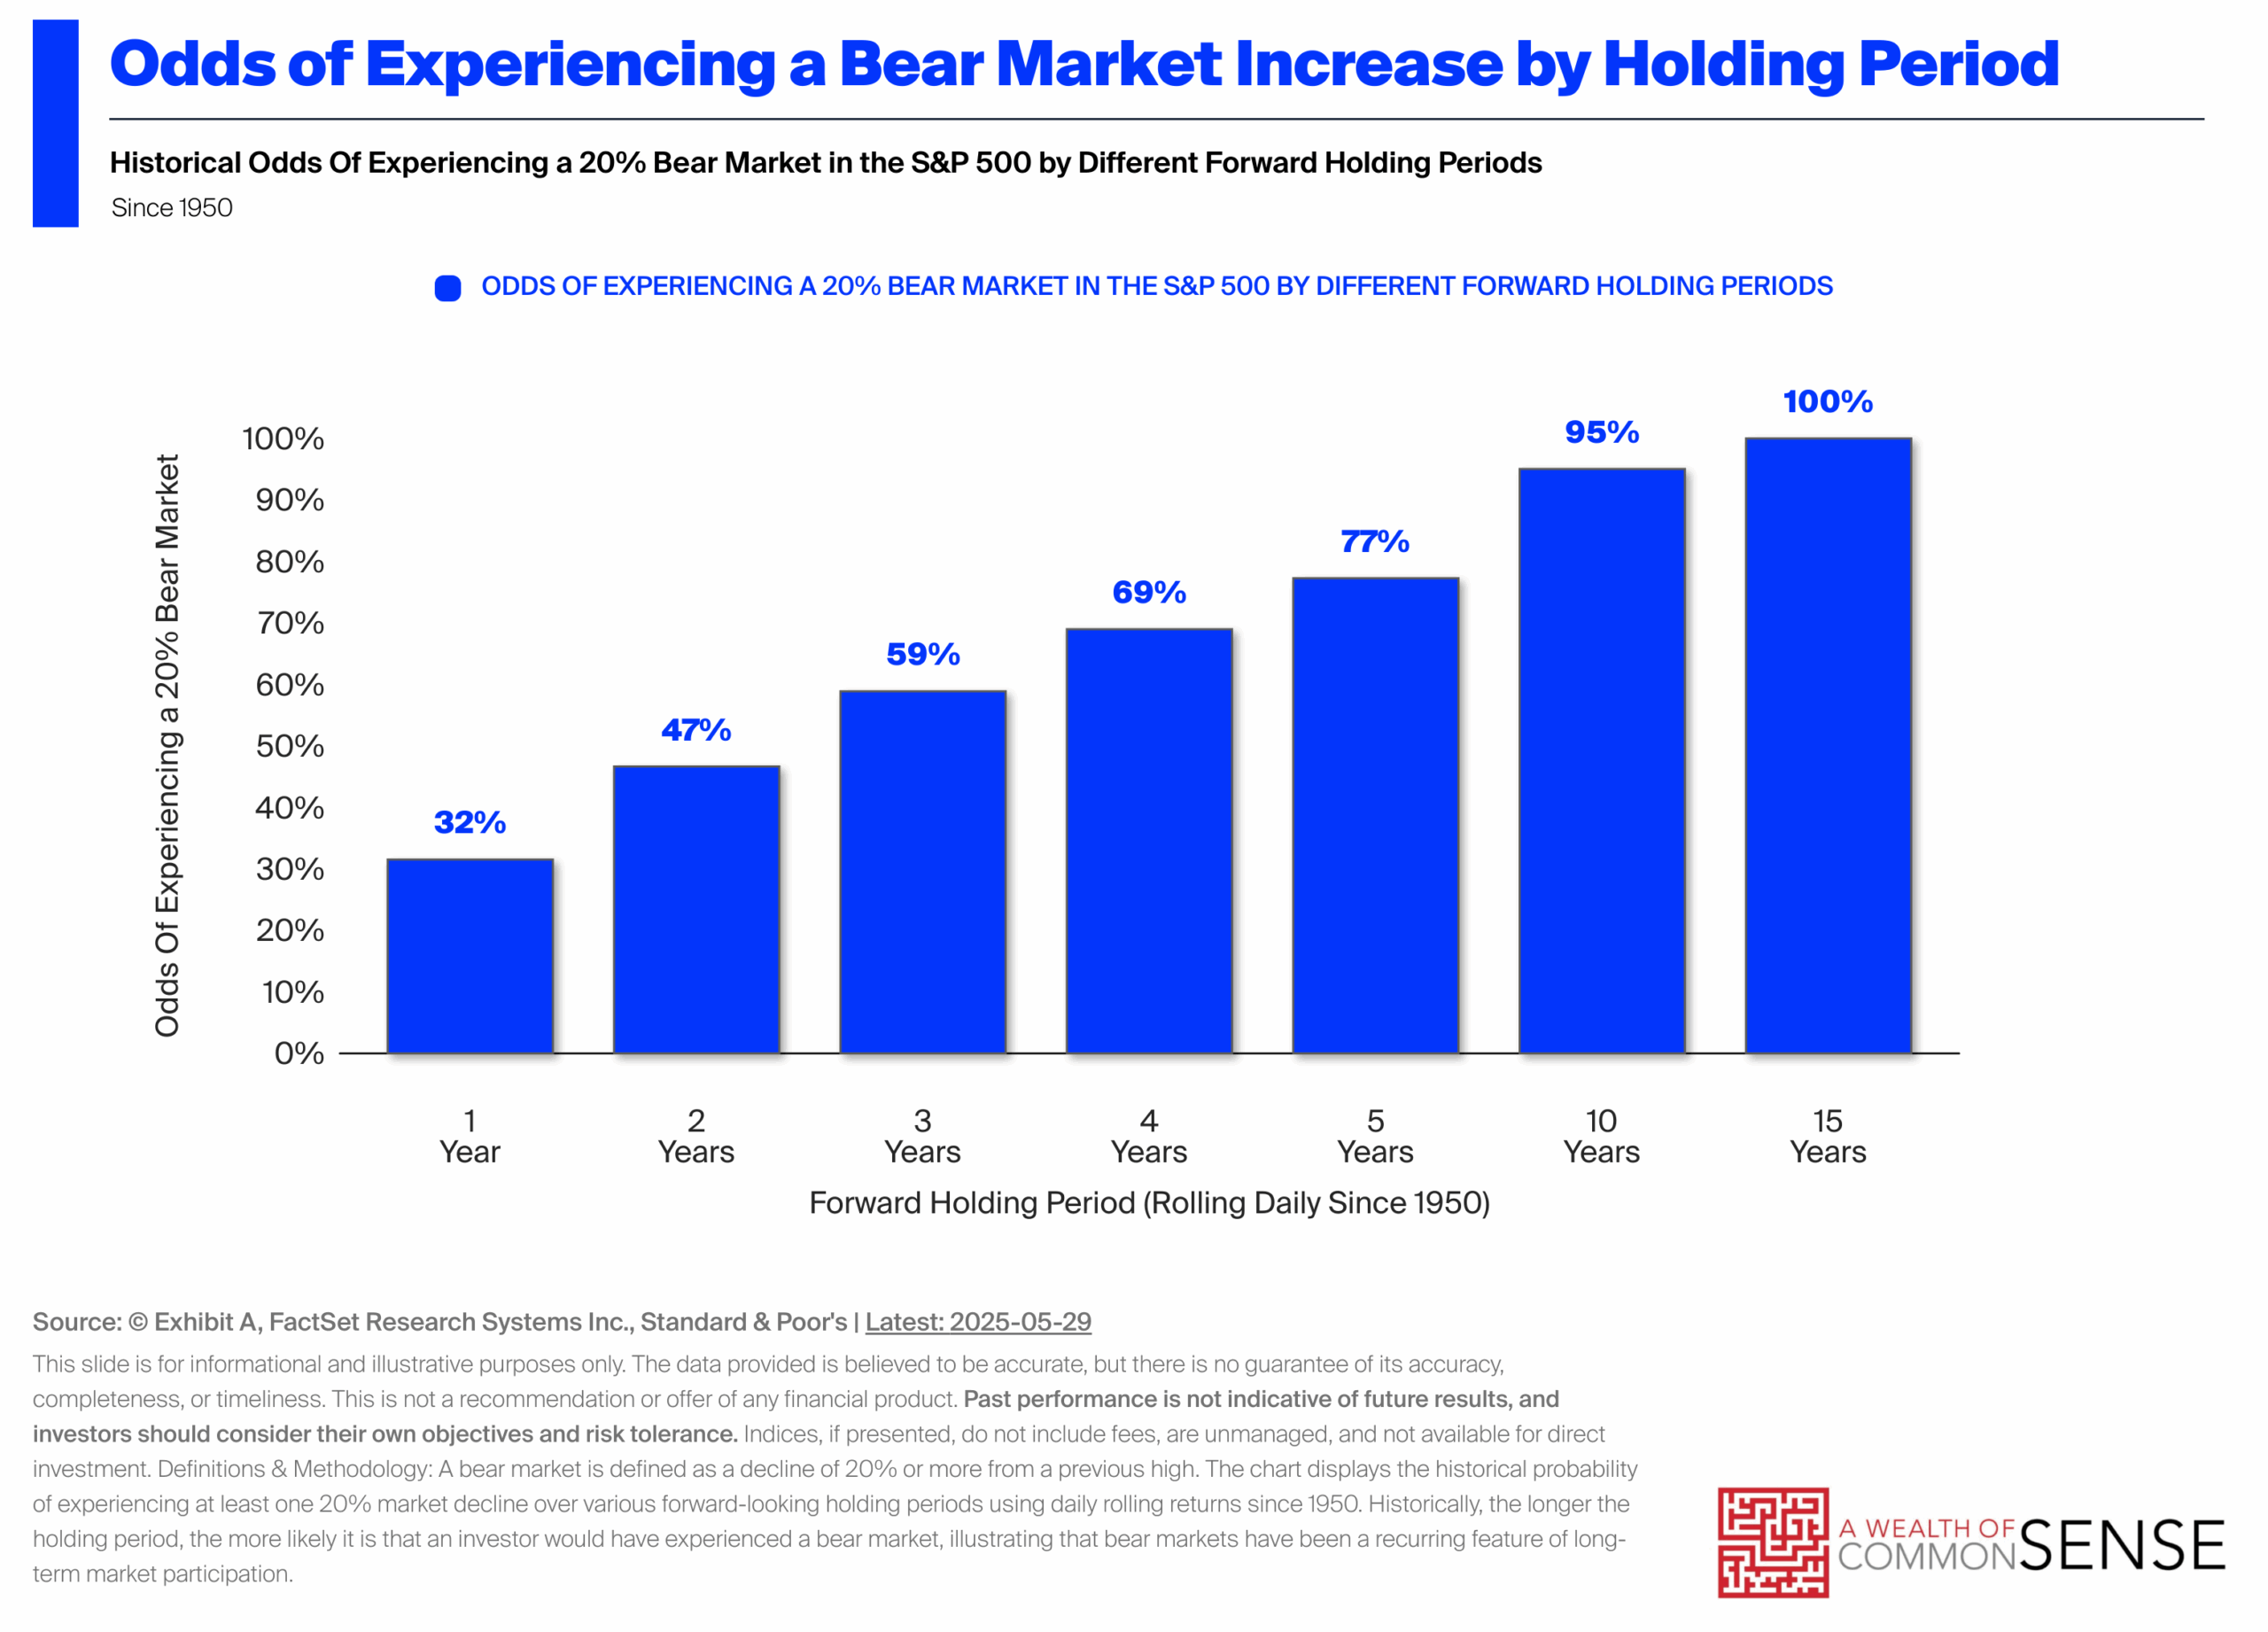
The longer your time horizon, the higher your odds of losing 20% or more of your money in the stock market.
The market has seen a bear market over 5 year windows nearly 80% of the time. It’s also seen positive returns roughly 80% of the time over 5 years.
You have both a good chance of profits and a painful downturn. This is a feature, not a bug when it comes to investing in stocks. Staying invested almost assures you’ll lose lots of money at some point.
This is the dichotomy of successful long-term investing.
The longer you stay in the game, the better off you will be. Survival is one of the most important attributes of successful investing.
However, if you extend your time horizon, you are highly likely to get your face ripped off.
You either need to be steady-handed or right-size your asset allocation to account for this fact.
The specific level of gains and losses is not guaranteed. Sometimes, the up markets are enormous, while other times, the gains are more muted. Sometimes, the down markets are bone-crushing, while other times, they’re a mere flesh wound.
There aren’t many guarantees when investing in risk assets. But risk is one of them.
Corrections, bear markets and crashes are inevitable.
It has to be this way.
No pain, no gain.
Further Reading:
10% Returns in the Stock Market
If you’re an advisor and want to use these charts for client communication — using your firm’s logo — sign up for a free 7 day trial at Exhibit A. Every Friday we send out a chart of the week along with talking points. Plus, there’s a huge library of charts that get updated on a regular basis.
