The stock market looks a lot like the wealth profile in this country — the rich keep getting richer.
That richness can be expressed in a couple of different ways.
First up is market cap. The biggest stocks are a lot bigger than the others:
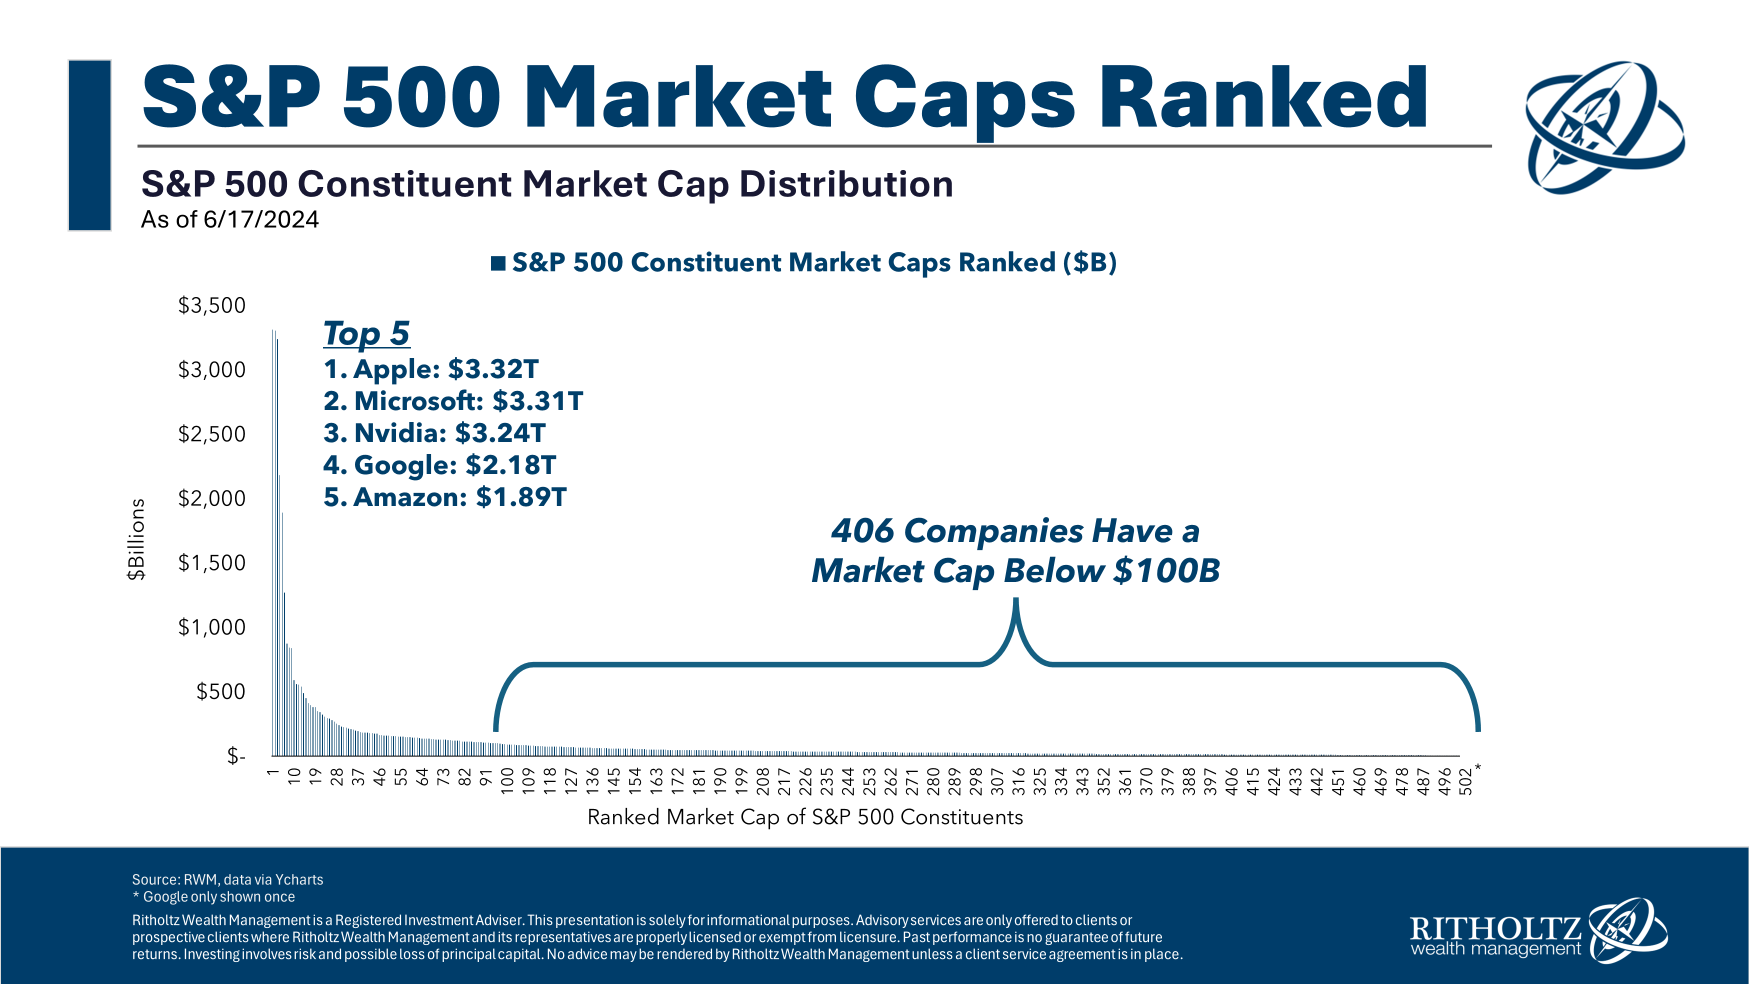
Corporations in the S&P 500 aren’t evenly distributed.
In fact, the top 25 companies in the S&P 500 are as big as the rest of the index combined.1
The biggest stocks also have the highest valuations. Torsten Slok from Apollo recently broke down PE ratios by S&P 500 deciles: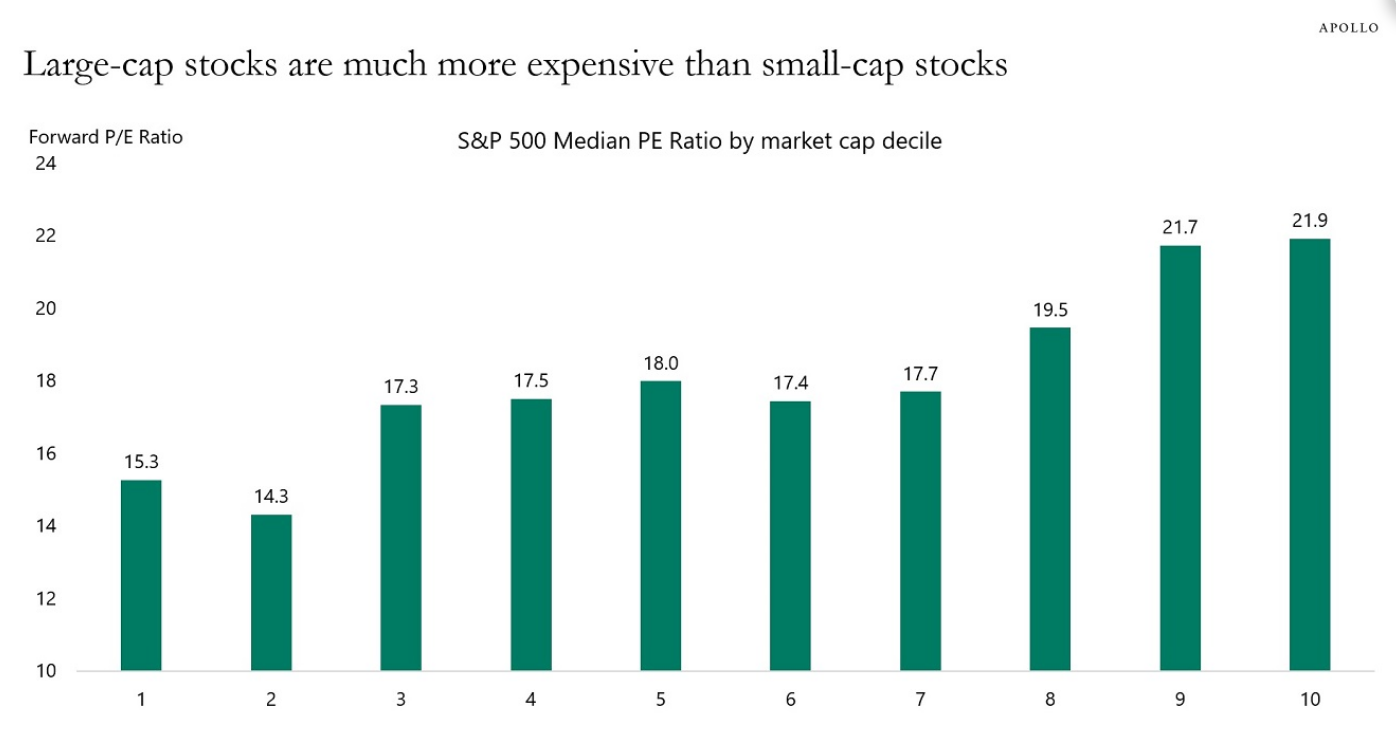
Higher market caps, higher valuations. Lower market caps, lower valuations.
The JP Morgan Guide to the Markets breaks this down even further by segmenting valuations by the top 10 stocks
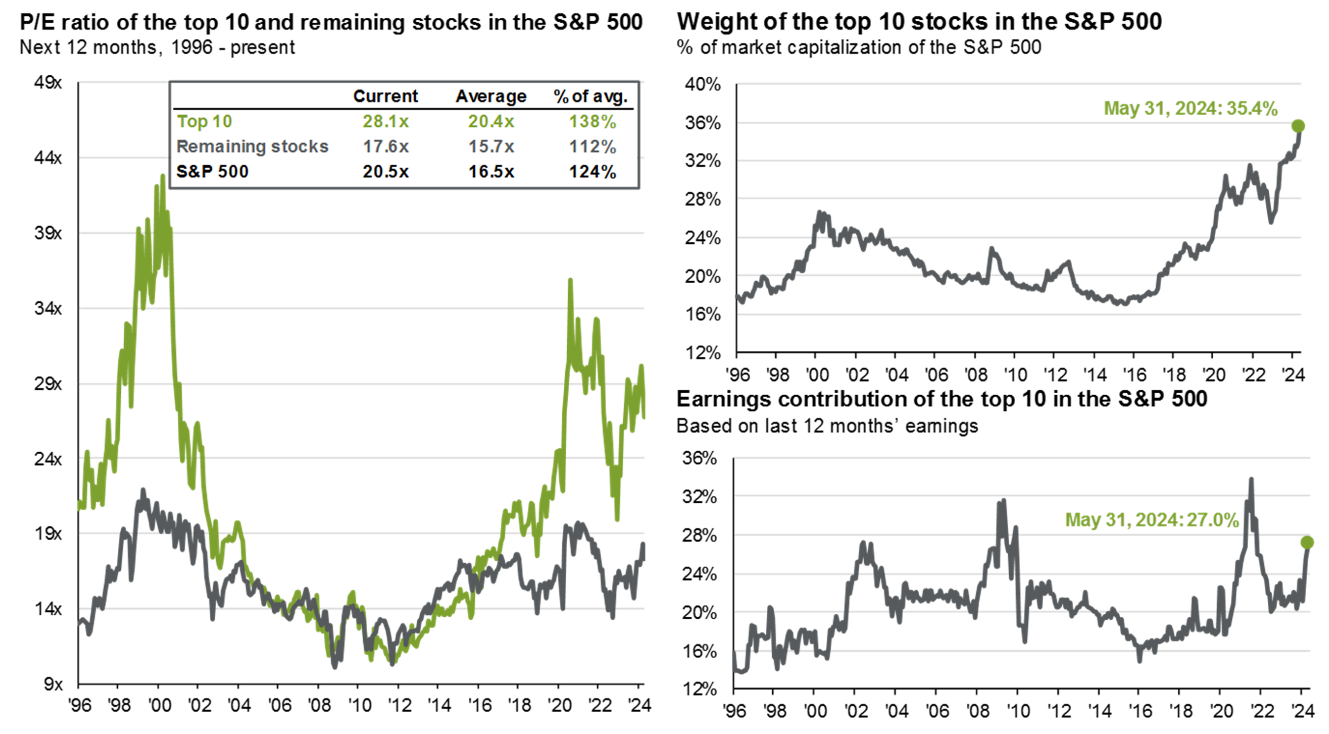
The top 10 stocks look relatively pricey when it comes to valuations. The rest of the market looks OK.
Of course, there is a reason the biggest stocks have a valuation premium over the rest of the market. They’ve earned it. These companies have continued to innovate and grow at levels we’ve never seen before at this scale and that’s been reflected in their returns.
Here’s a look at the performance by decile over the past five years:
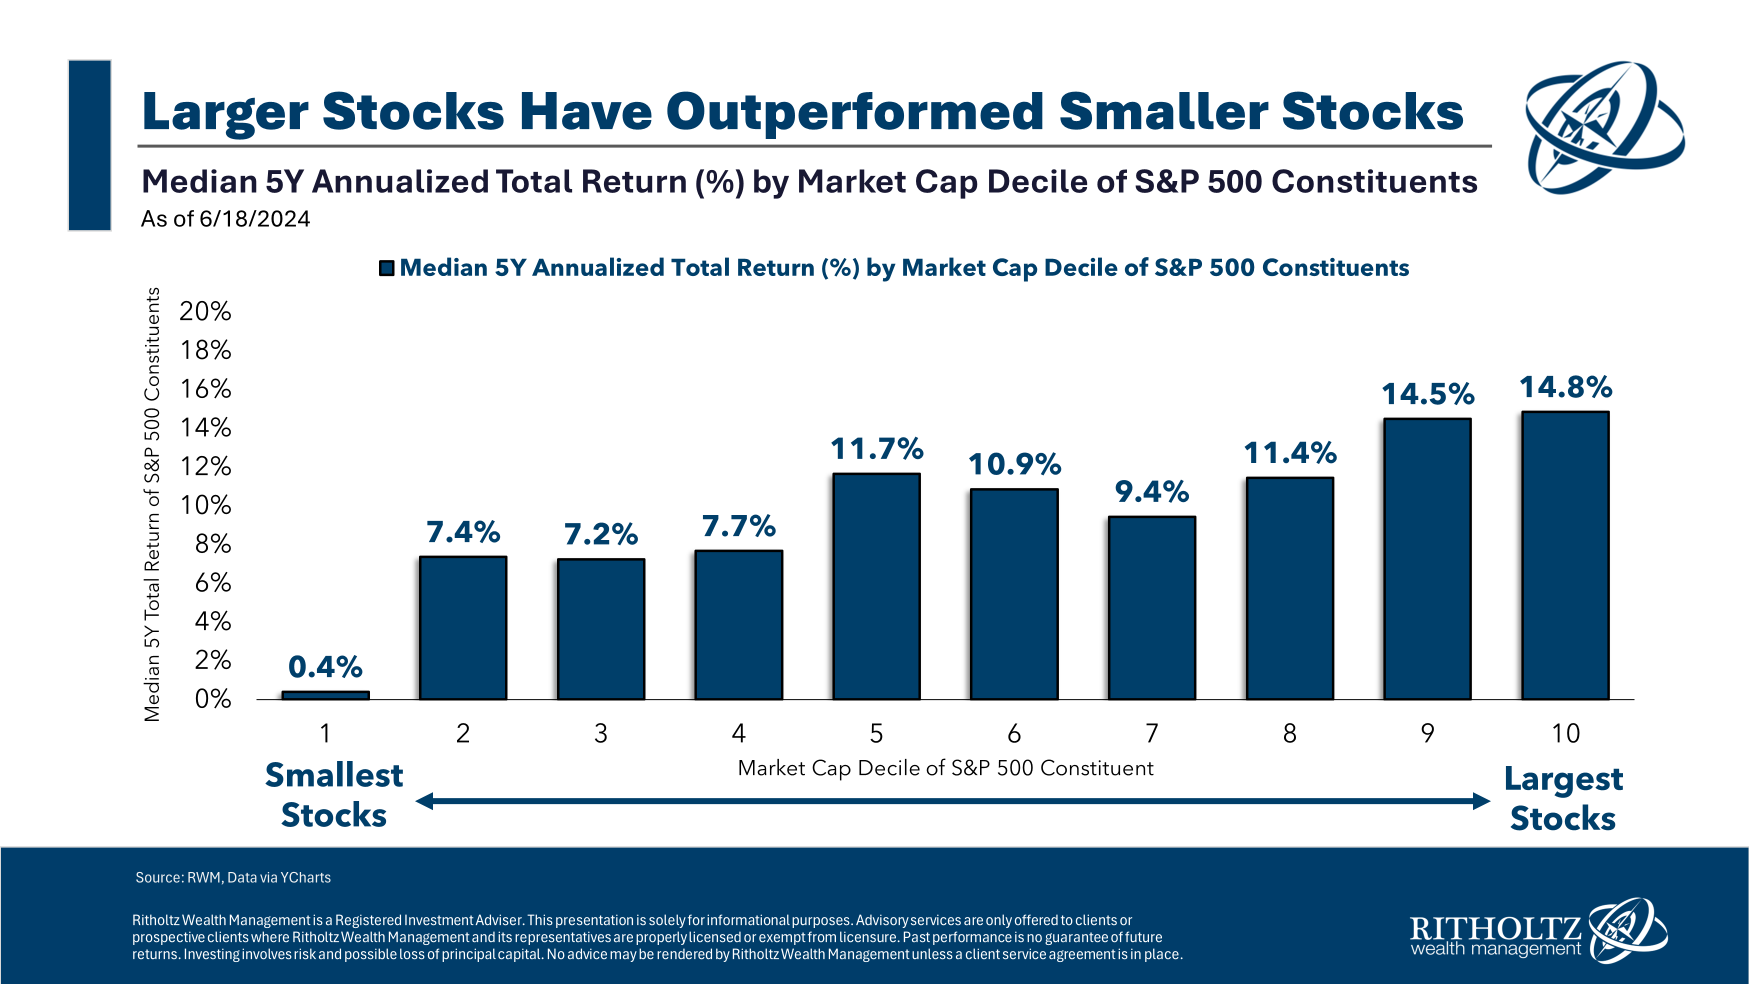
The biggest companies have had the best returns while the smallest companies have been left in the dust. Case closed right?
Not so fast my friends.
Those numbers show the trailing returns for the current biggest stocks, not necessarily the biggest stocks five years ago.
Some of the big stocks of today were smaller five years ago. Some of the smaller stocks today were bigger five years ago.
Five years ago, Nvidia was outside the top 60 stocks in the S&P 500. Three years ago, it had just barely cracked the top 10 list of names with an S&P 500 weighting of just 1%. Today, Nvidia makes up more than 7% of the index and is neck and neck with Apple and Microsoft as the largest stock in the entire market.
Now let’s look at the returns by decile using the size of these companies five years ago as the starting point: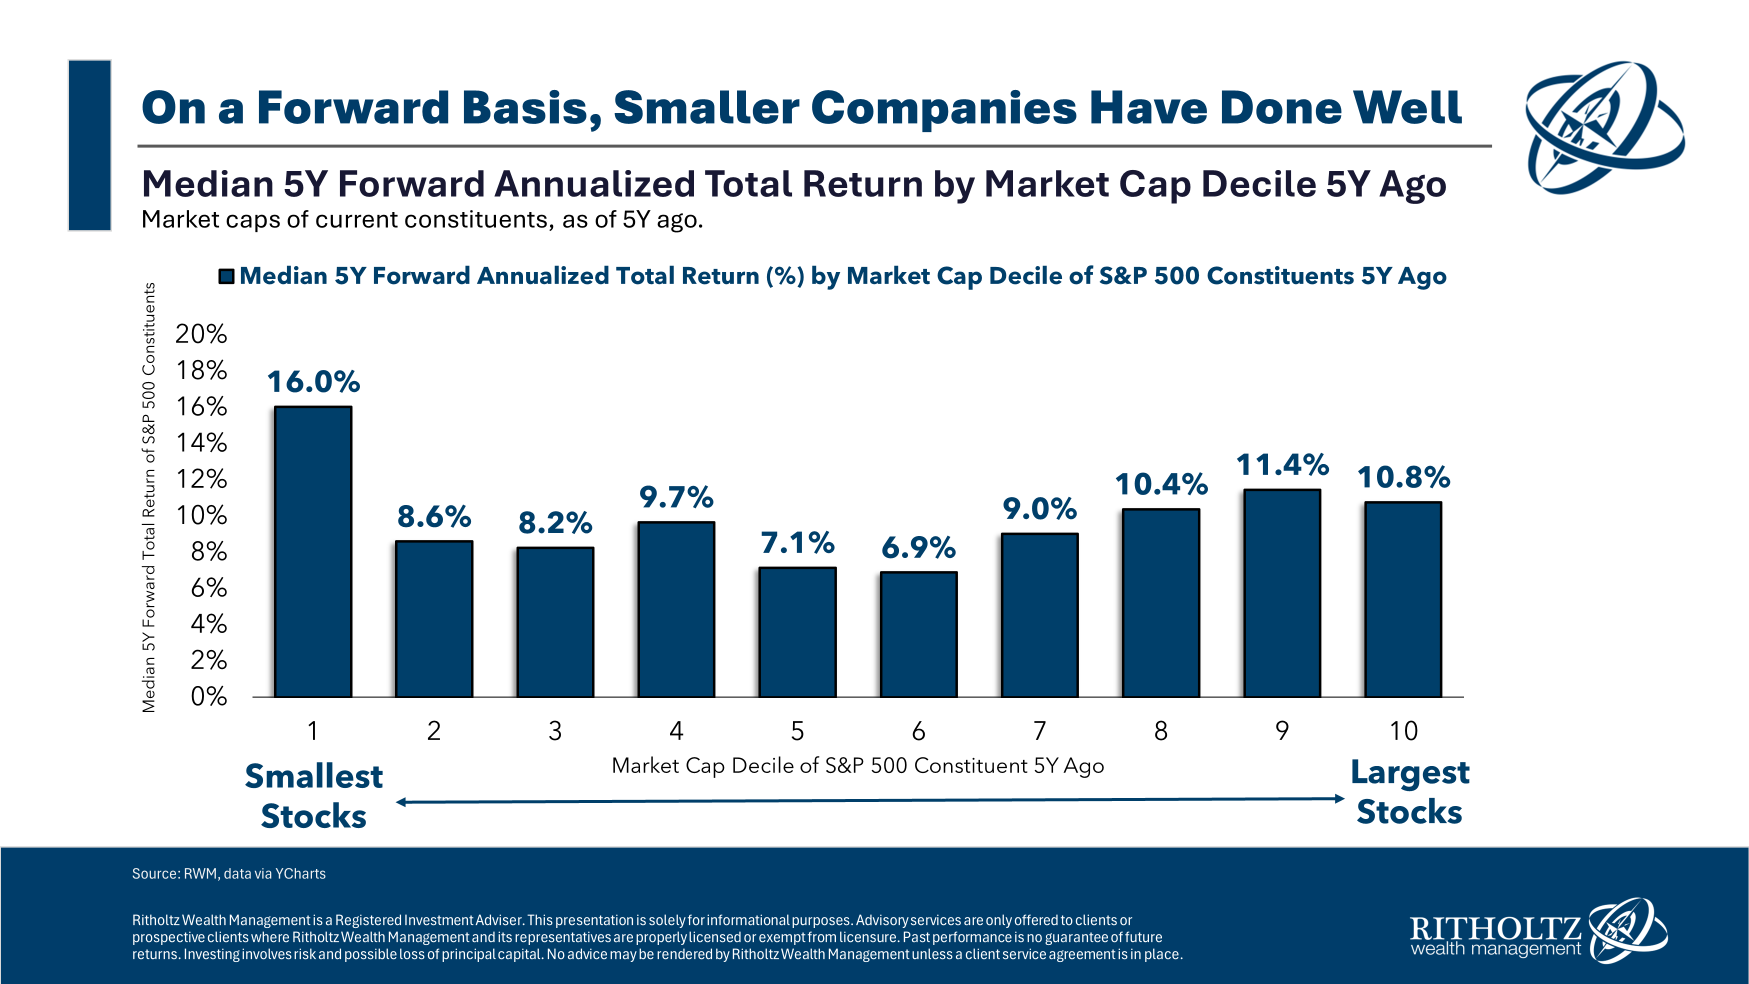
Now this is interesting.
The largest stocks from five years ago still have impressive returns but the top performer was the smallest decile of companies in the S&P 500.
It’s actually out of the ordinary for the biggest stocks in the index to outperform.
History shows the best time to buy these companies is before they reach the top 10. This seems obvious but it’s worth revisiting this excellent research from Dimensional Fund Advisors:
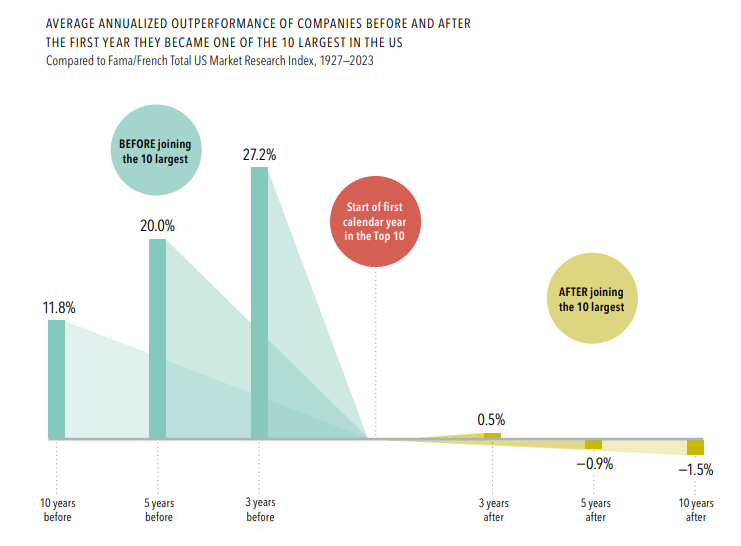
Outperformance comes from the journey to the top 10, which can be breathtaking.
However, once these companies reach the summit, it’s much harder to maintain that outperformance.
I don’t know if Apple, Microsoft, Nvidia, Google, Amazon or Facebook will underperform from current levels.
Maybe we are entering a new paradigm of market behavior. These companies have already become bigger and more powerful than I could have imagined a decade ago.
But it would make sense to me that once companies become so large it becomes much harder to keep up the same levels of growth.
As Warren Buffett once noted, “Size is the enemy of outperformance.”
Further Reading:
Why Value Died
1That would be 478 stocks since there are 503 in total.
