2022 was one of the worst years ever for financial markets.
Over the past 100 years:
It was the third worst year for a 60/40 portfolio.
It was the seventh worst year for the S&P 500.
It was the worst year ever for the Barclays Aggregate Bond Market Index.
It was the worst year ever for the 10 year Treasury bond.
Here’s what I wrote last year at this time:
Expected returns are now higher.
I don’t have the ability to predict the timing or magnitude of those higher expected returns but there is now a much bigger cushion for investors than there has been in years as far as yields are concerned.
The other good news is every time we’ve ever had bad times in the past they turned out to be wonderful opportunities for long-term investors.
There are no guarantees but things should be better for investors in the future as long as you have enough patience and perspective.
There are typically two outcomes as to what happens after an awful year like 2022 — you get a bounce-back recovery, or the bad times continue.
Luckily, 2023 was the former not the latter. Expected returns were higher and actual returns followed suit.
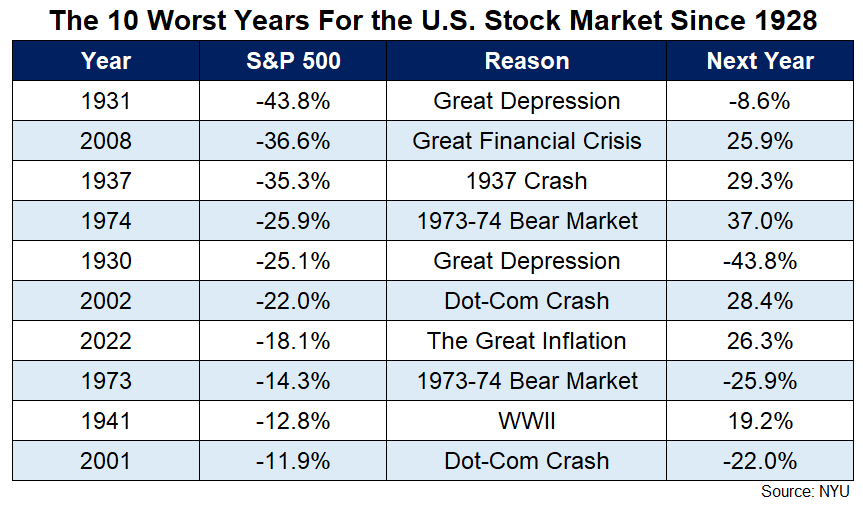
Here’s a look at the worst annual returns for the S&P 500 over the past 100 years or so along with performance in the ensuing year:
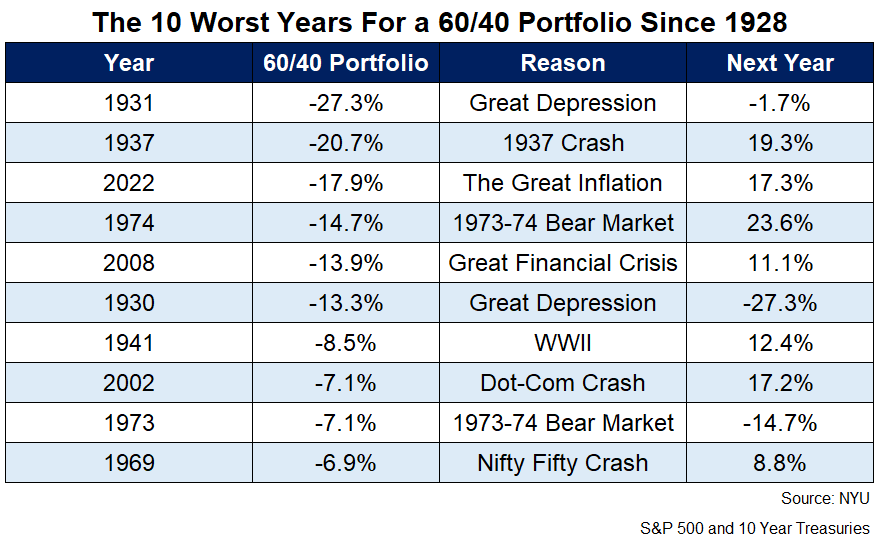
And here is a look at what happens to a 60/40 portfolio following a bad year:
2023 was a good year.
The stock market did most of the heavy lifting but bonds did alright too.
The 10 year Treasury bond had a decent year which is kind of a miracle considering what happened to interest rates in 2023.
The 10-year yield started the year at 3.9%. It got as low as 3.3% then shot all the way up to 5% by the end of October. Rates fell from there to finish the year right back at 3.9%. It was a roundtrip.
The 10 year returned close to 4% on the year1 which helped a 60/40 portfolio of U.S. stocks and Treasury bonds return more than 17% in 2023.
I guess the 60/40 portfolio wasn’t dead after all.
Tech stocks were up a ton this year after getting crushed last year.
The Nasdaq 100 fell 33% in 2022. In 2023, it was up 55%, one of its best years ever.
The biggest stocks certainly made a difference this year but it wasn’t just the Magnificent 7 that were up in 2023.
The Russell 2000 Index of small cap stocks was up 17%.
The S&P 400 Mid Cap Index gained more than 16%.
The S&P 500 Equal Weight finished the year with a gain of almost 14%.
Even international stocks came to life in 2023. The MSCI EAFE Index of international developed country stocks increased by nearly 19%.
The MSCI Emerging Markets Index grew more than 10%.
Last year it was nearly impossible to make money.
This year it would have been difficult to lose money.
There was no recession. The inflation rate fell. The unemployment rate didn’t rise past 4%. Gas prices dropped.
It was a good year.
So what does that mean for 2024?
In a follow-up piece I’ll look at the historical records of good years and what comes next.
Happy New Year.
Further Reading:
2022 Was One of the Worst Years Ever For Financial Markets
1The entire return was obviously all income since yields ended where they started.
