Here are some facts and figures about the S&P 500:
- According to Global Financial Data, the S&P only contained 90 stocks when it was created in 1928.
- It became the S&P 500 in 1957. At the time, the index was comprised of 425 industrial stocks, 60 utilities and 15 railroads.
- Financials and transportation stocks weren’t added until 1976.
- In the late-1980s, the index was finally revamped to account for the more modern U.S. economy.
- Today, the market cap of the S&P 500 is rapidly approaching $50 trillion.
- The top 10 stocks alone are worth nearly $17 trillion or more than 35% of the total.
- The top 25 stocks account for 48% of the market cap.
- Six stocks are worth more than $1 trillion: Microsoft, Apple, Nvidia, Google, Amazon, and Facebook (these six companies are 29% of the index).
- The tech sector makes up roughly one-third of the index but is likely bigger than that when you consider the companies included in the Communication Services (Google, Facebook and Netflix) and Consumer Discretionary (Amazon) sectors.
- The S&P now makes up nearly 40% of global equity market share (it was more like 20% heading into the 2008 financial crisis).
The S&P 500 is a big part of the U.S. economy but there are plenty of differences between the stock market and the economy.
For instance, the technology sector has an outsized impact on S&P 500 earnings growth over time: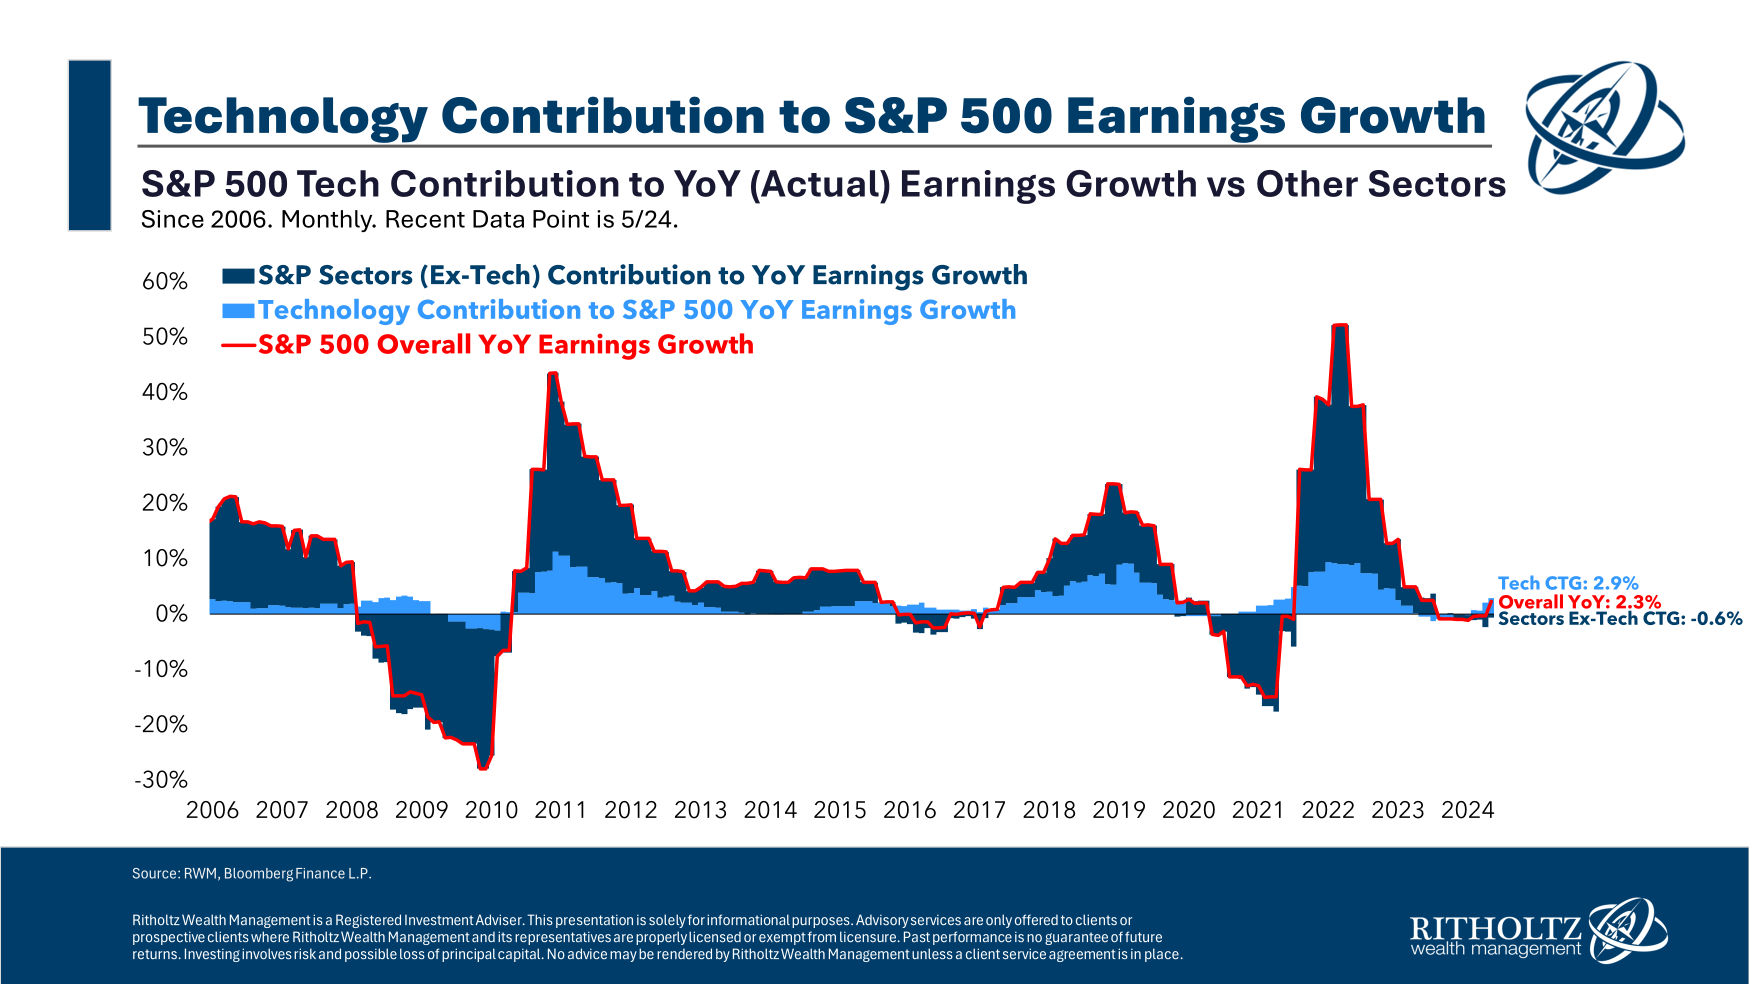
Depending on the time frame, the tech sector can make up the majority of both earnings gains and losses. The same is true of sales:
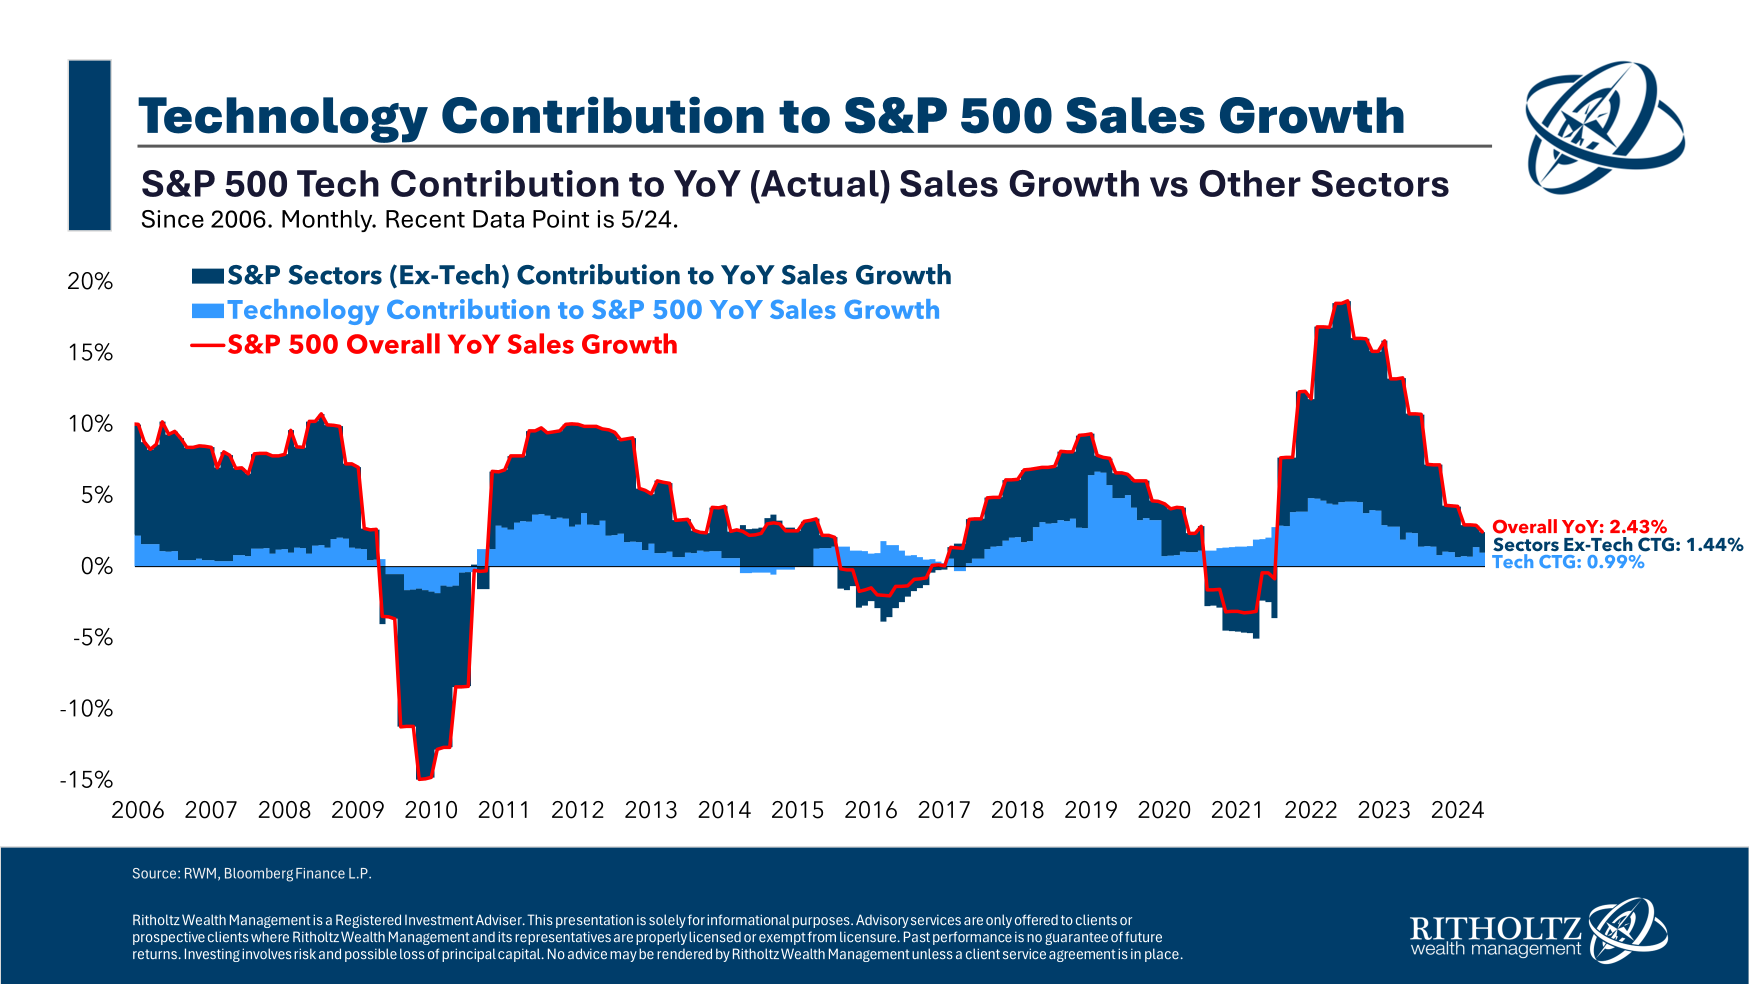
The BEA estimates tech’s contribution to GDP to be 10%.1 That’s still close to $3 trillion but the economy is far more diversified and spread out than the stock market.
A decent chunk of sales for S&P 500 companies also comes from outside our borders:
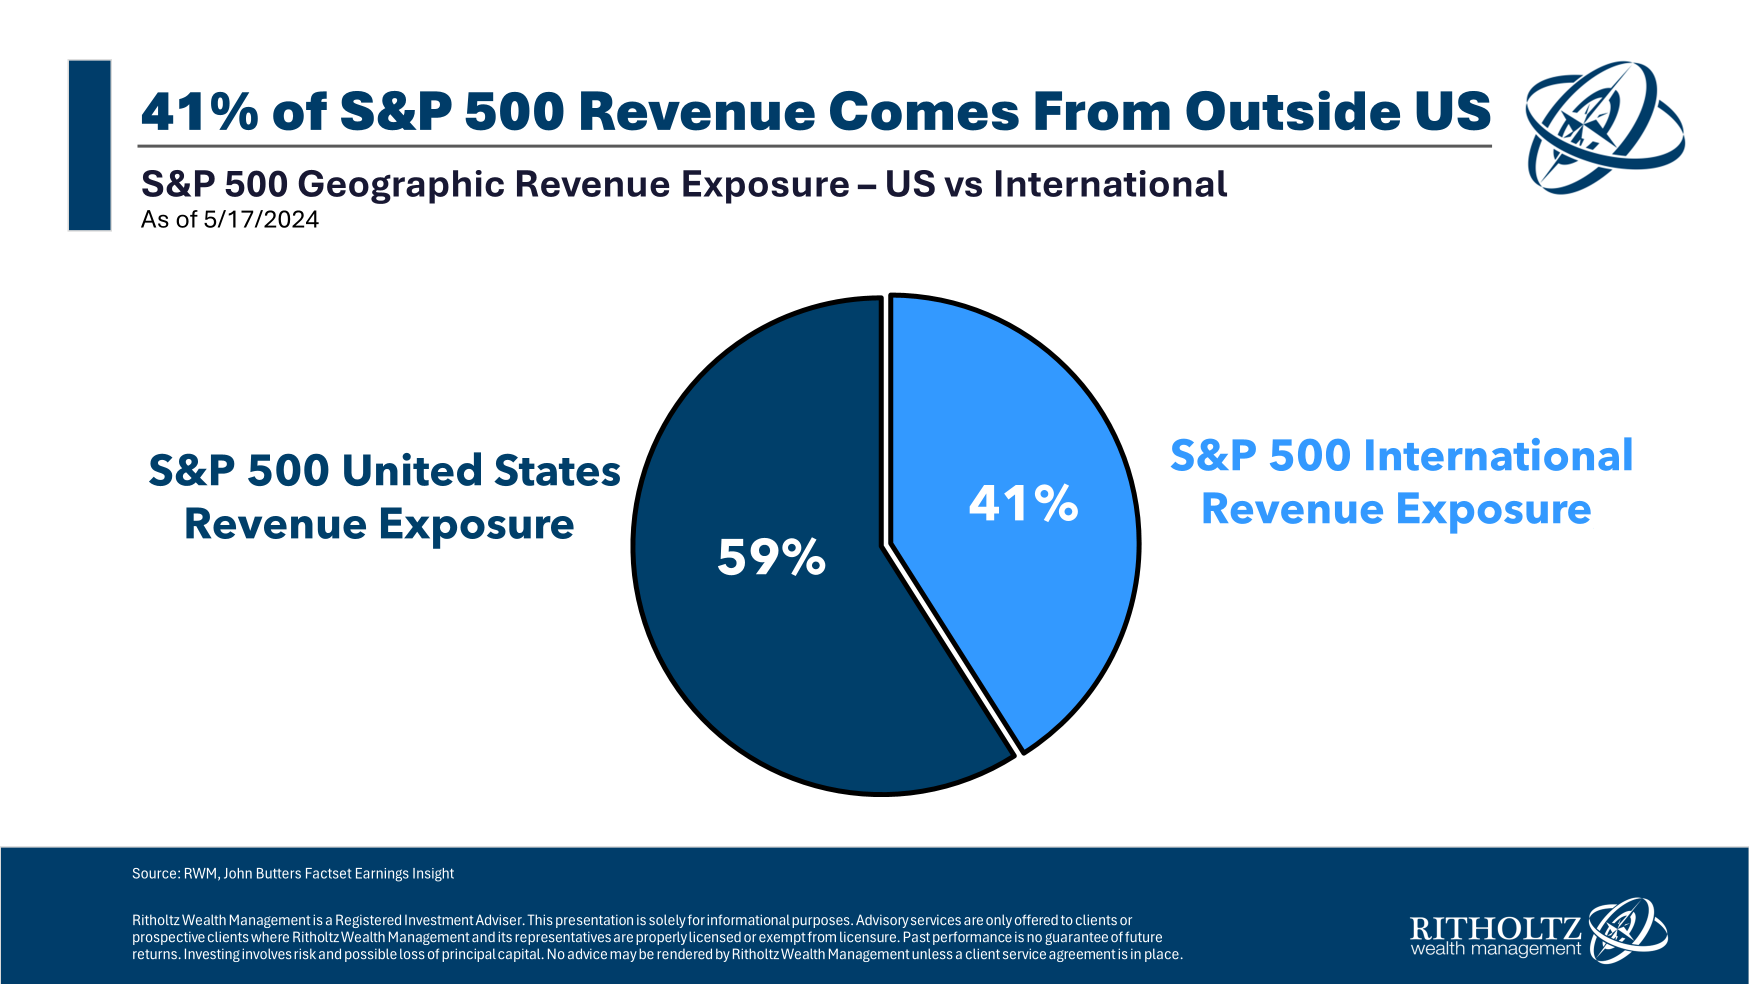
The S&P 500 is a U.S. index but it is comprised of global corporations.
Apollo’s Torsten Slok has some excellent charts that highlight the differences between the stock market and the economy.
S&P 500 companies are enormous but the majority of firms with $100 million or more in sales are private companies: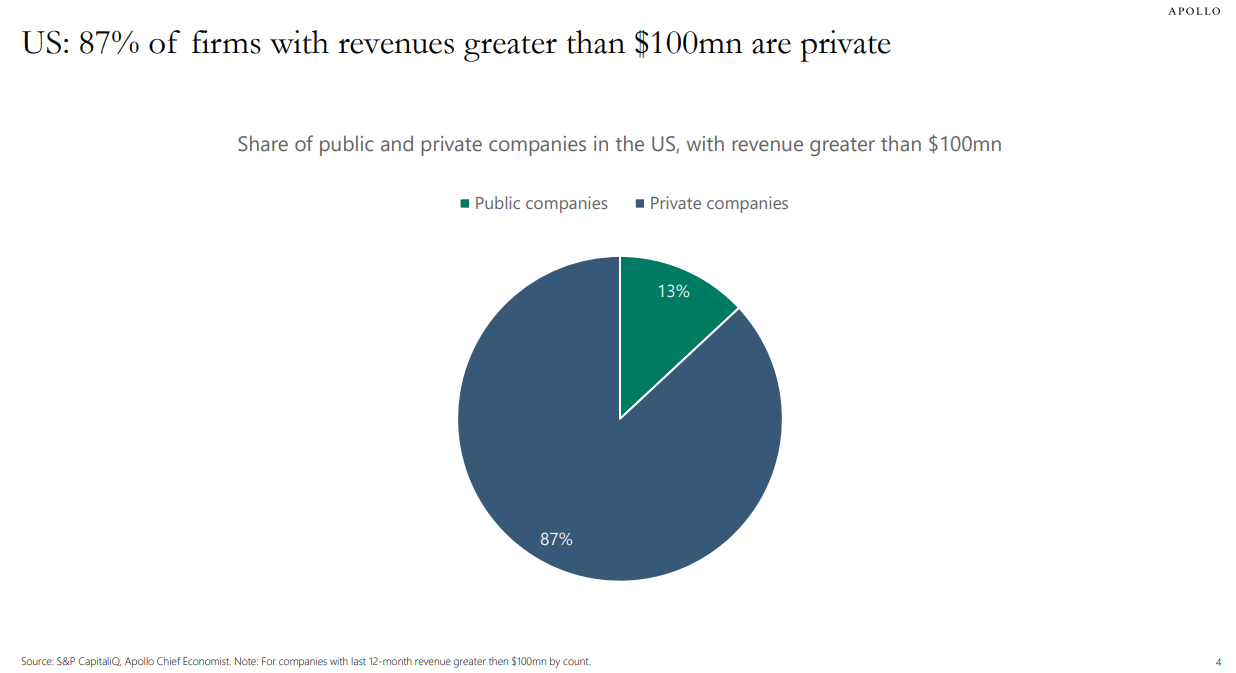
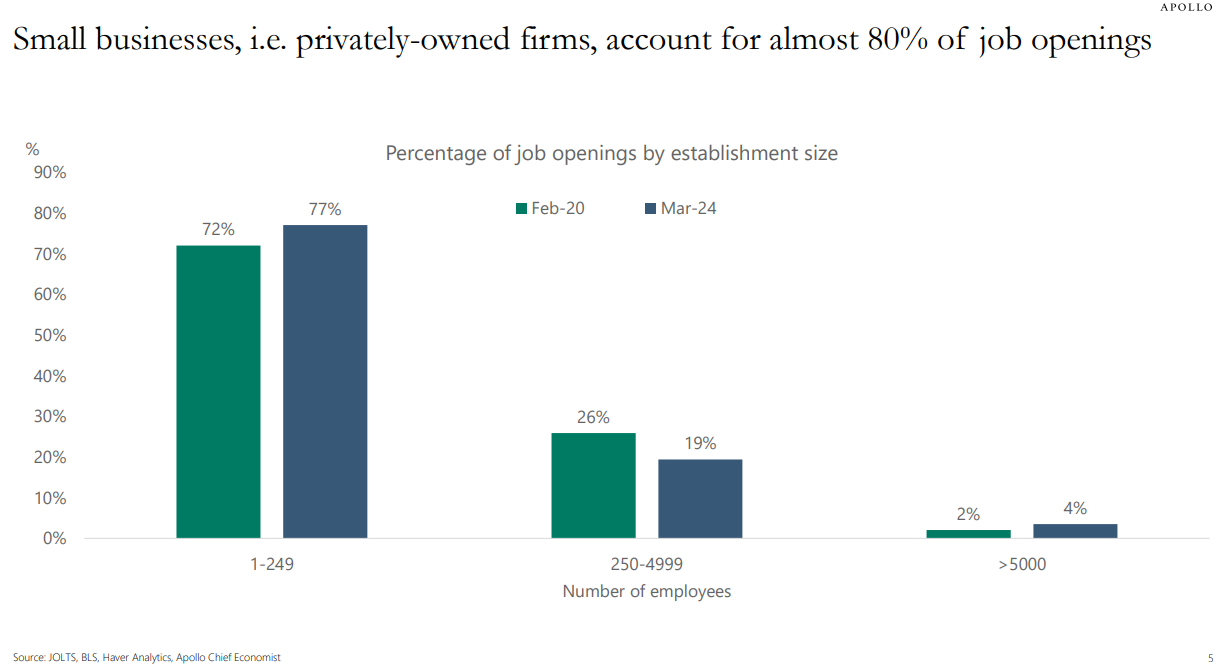
Most of the job openings come from smaller, privately-owned businesses as well:
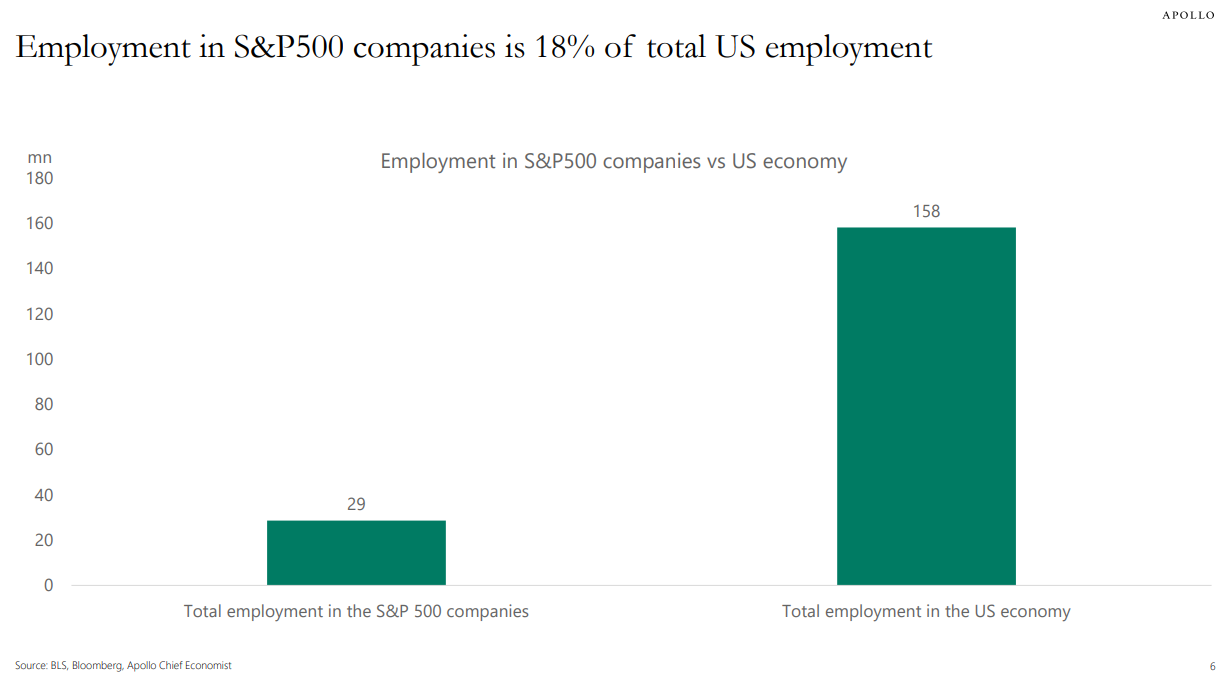
S&P 500 companies account for roughly 1 in 5 jobs in the United States:
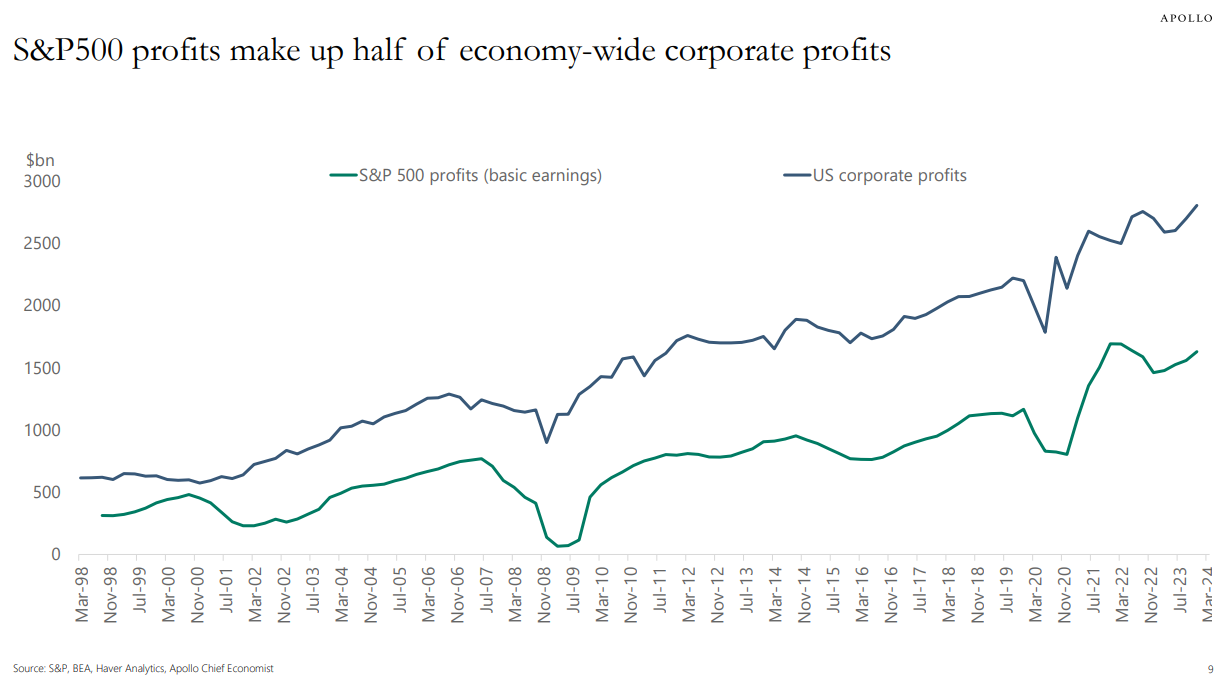
But these corporations are insanely efficient and profitable, accounting for half of the profits in America:
Sometimes the stock market follows the economy. Sometimes the market front-runs the economy. Sometimes the market rises or falls even when the economy doesn’t.
If you ever find yourself thinking that the stock market doesn’t make a lot of sense that’s because sometimes it marches to the beat of its own drummer. At times that drummer is a raging lunatic.
The stock market and the economy need each other but they’re different animals.
Michael and I talked about the S&P 500 vs. the economy and much more on this week’s Animal Spirits video:
Subscribe to The Compound so you never miss an episode.
Further Reading:
What’s Driving Stock Market Returns?
Now here’s what I’ve been reading lately:
- How to build 300k airplanes in 5 years (Construction Physics)
- The best free financial newsletter (TKer)
- Imprisoned for life by causing a flood to party more (Historic Flux)
- How lies spread (Irrelevant Investor)
- How many people actually track their spending? (Politico)
- Summer camps and parenting panics (The New Yorker)
Books:
1You could probably quibble with this number since tech is now so ingrained in everything we do.

